Beyond the Chart: Fusing Macro Liquidity and Crypto-Native Signals
March 22, 2026
As quantitative traders, it's easy to get tunnel vision looking only at price and volume. We recently stepped back to conduct a comprehensive, two-part research study on exogenous signals—data strictly outside of the core asset's technicals. Our goal was simple: Is there statistically meaningful, tradeable correlation between macro/crypto-native data and Bitcoin's price behavior?
We investigated everything from the Federal Reserve's balance sheet to stablecoin issuance and open interest dynamics. What we found was that while many signals are far too noisy to be used as directional triggers, a select few serve as exceptionally powerful filters and circuit breakers.
Here is our synthesis of the "Minimal Signal Set" that actually matters.
1. The Fuel: Net Liquidity (Macro Regime)
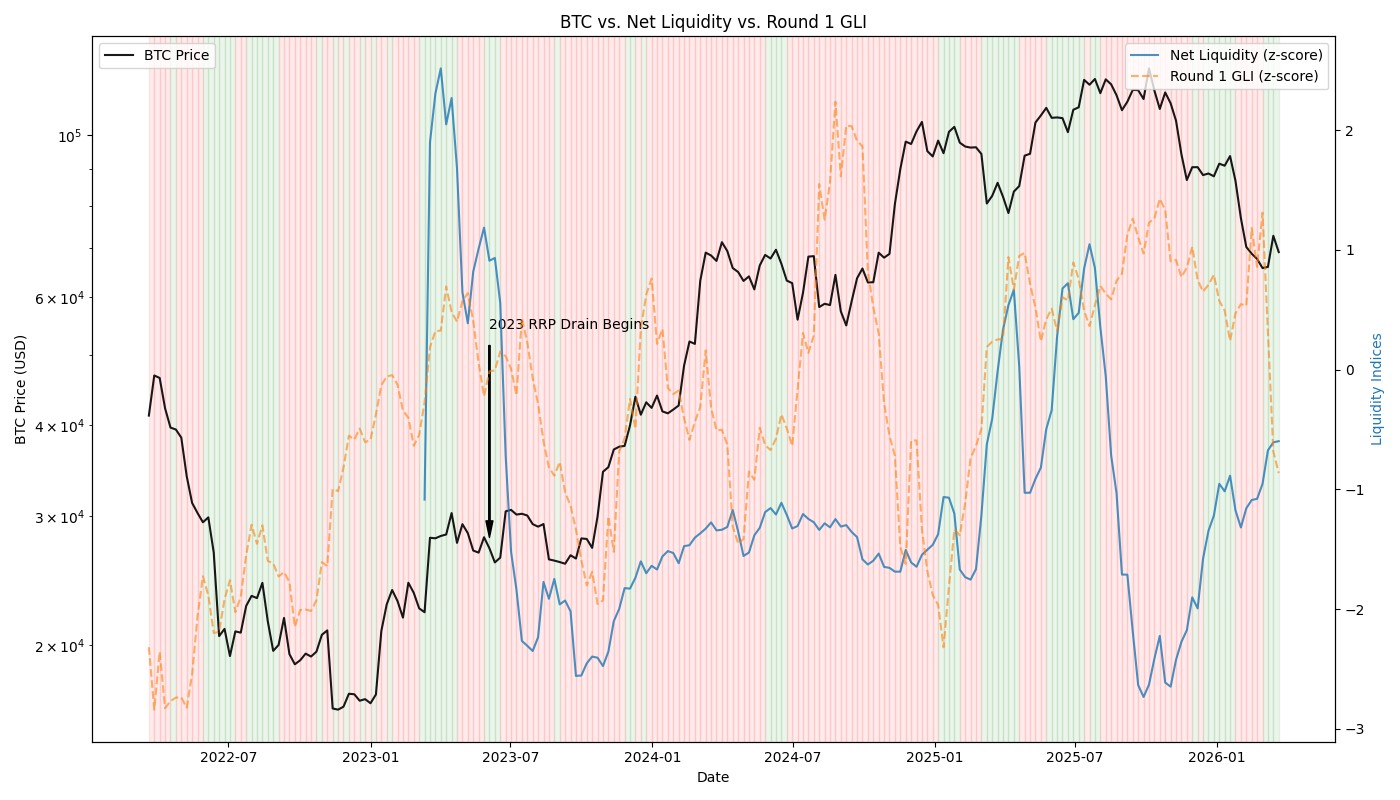
Gross macro metrics like the M2 money supply or the Fed's raw balance sheet (WALCL) proved too slow and noisy. Instead, we found a much more precise leading indicator in Net Liquidity:
The Finding: Net Liquidity represents the actual "fuel" available in the financial system. We observed that the major drain of the Reverse Repo Facility in 2023 was a primary driver of the BTC breakout, overriding traditional bearish macro signals. Net Liquidity serves as our long-term trend permission filter.
2. The Global Switch: VIX & Market Stress
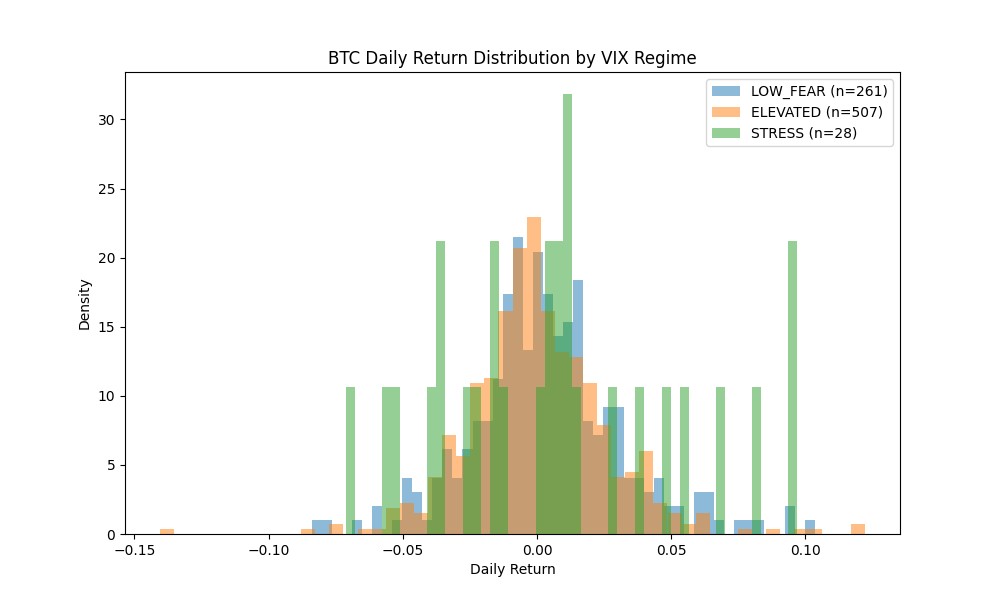
Crypto behaves as a high-beta risk asset. We segmented market conditions into 'Low Fear', 'Elevated', and 'Stress' regimes based on the VIX.
The Finding: BTC exhibits significantly higher Sharpe ratios during VIX 'Stress' (>25) and 'Low Fear' (<15) regimes. Most interestingly, correlation with equities (SPY/QQQ) spikes dramatically during the 'Elevated' regime (15-25), acting as a contagion warning.
VIX is our global risk-off binary switch: when it enters the 15-25 danger zone, sizing should be reduced.
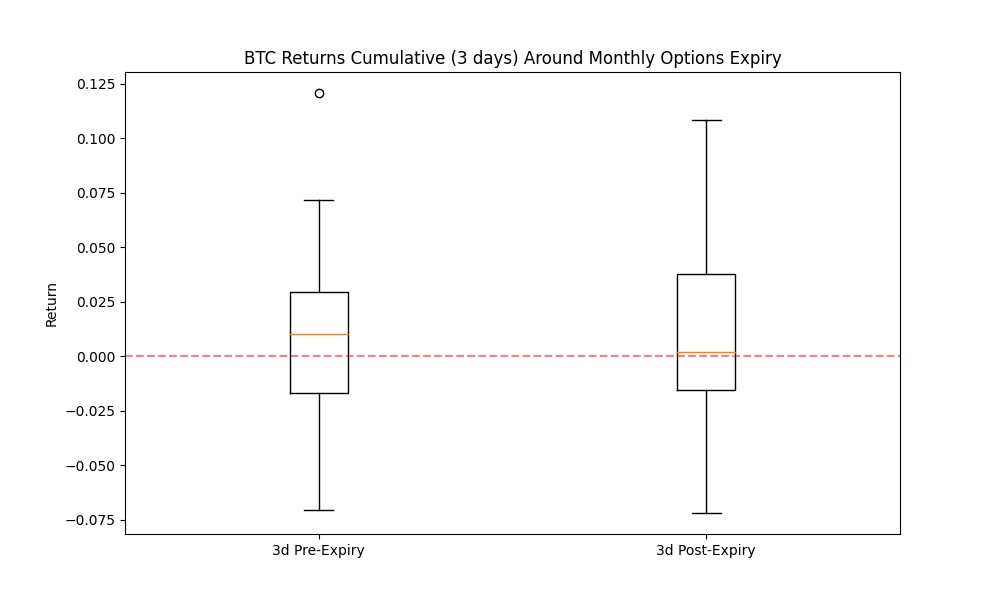
3. Scheduled Volatility: CPI and Options Expiries
Volatility is not random. We analyzed specific calendar events, notably CPI releases and Deribit's monthly options expiries.
The Finding:
These known windows are prime candidates for Circuit Breakers—taking the system offline or tightening stops to survive the chop.
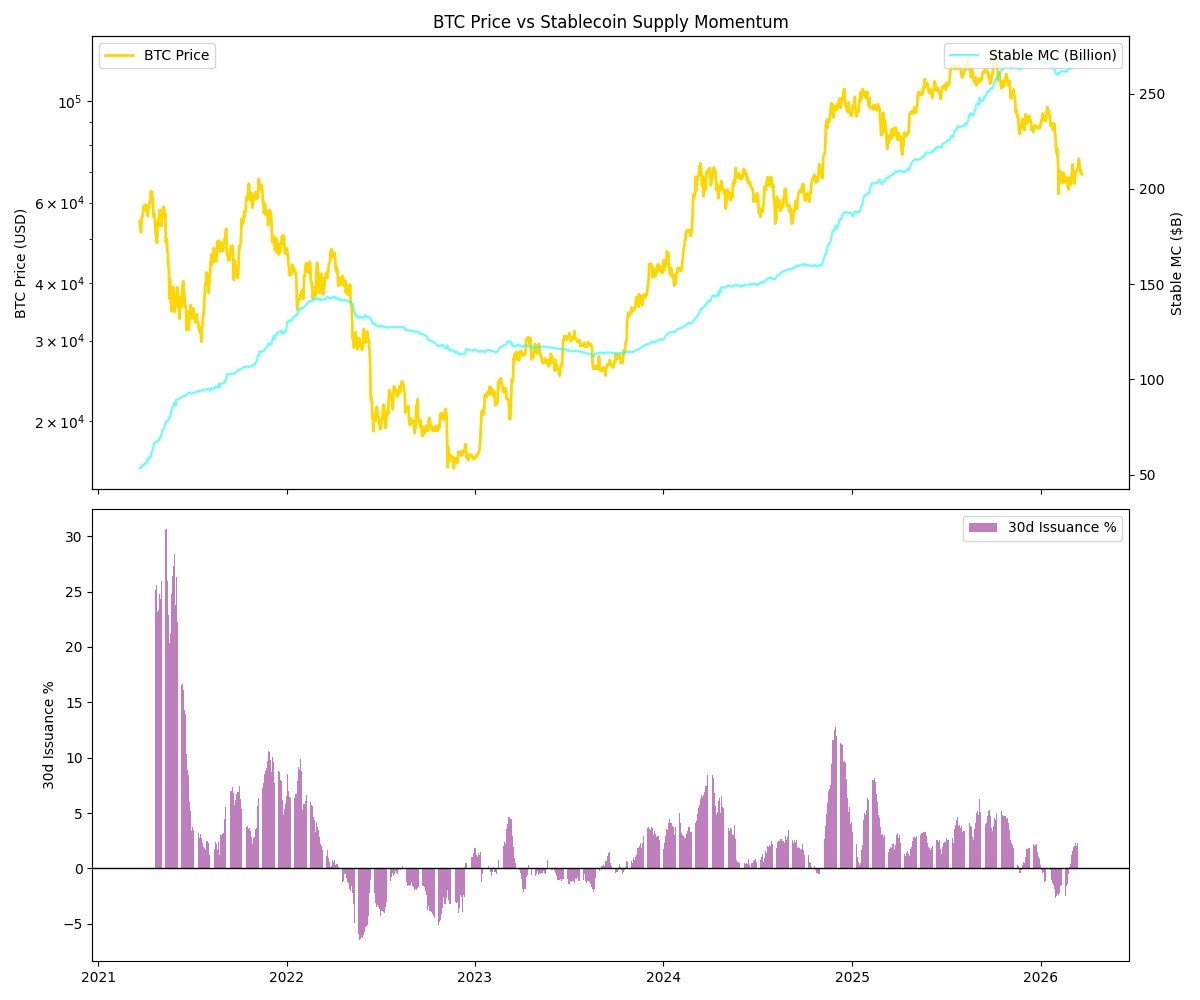
4. The Crypto Ecosystem: Stablecoin Momentum
To gauge crypto-native dry powder, we analyzed the combined market capitalization of USDT and USDC, focusing on the 30-day rate of change.
The Finding: This is the strongest leading indicator we found.
Stablecoin momentum acts as an intermediate trend bias. If stablecoin supply is shrinking, the market is structurally starved for bids.
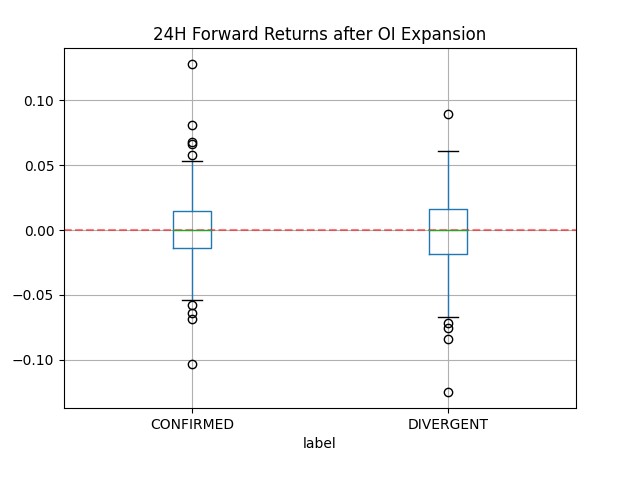
5. Leverage Exhaustion: OI Divergence
Open Interest (OI) naturally grows with price, so we normalized OI (by dividing by price) and tracked 30-day rolling Z-scores to spot abnormal leverage buildups.
The Finding: Not all OI expansion is equal. If OI spikes rapidly without price follow-through (what we term a DIVERGENT event), it reliably marks a local top or a "wash" setup. Divergent events preceded a mean -1.41% return over the next 72 hours. It is an excellent short-term filter to prevent buying the top of a levered run.
Conclusion: The Minimal Signal Set
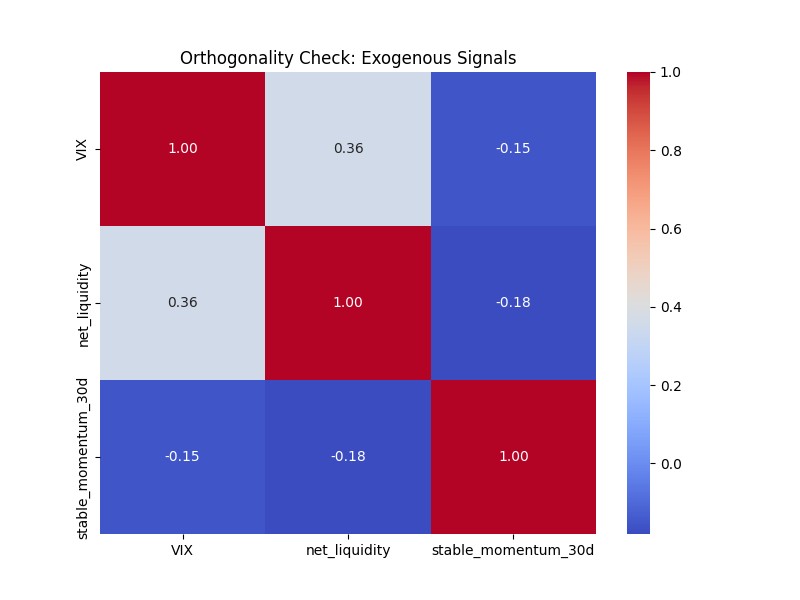
The true test of any indicator set is orthogonality—are they just different ways of measuring the same thing? We ran cross-correlations across the final signal set, and impressively, all signals exhibited a correlation of r < 0.4 with one another.
They are definitively measuring distinct failure modes:
Is there a "there" there? Absolutely. But the edge lies in using these signals as filters and circuit breakers to grant permission for technical strategies, rather than trying to trade them blindly.