stop guessing.
Most TradingView indicators lag behind the price. We build tools that show you the market's true skeleton—the volume and leverage that actually move the needle before the candle even closes.
Get Startedindicators
Precision-built tools that reveal the market's hidden structure — before the candle closes.
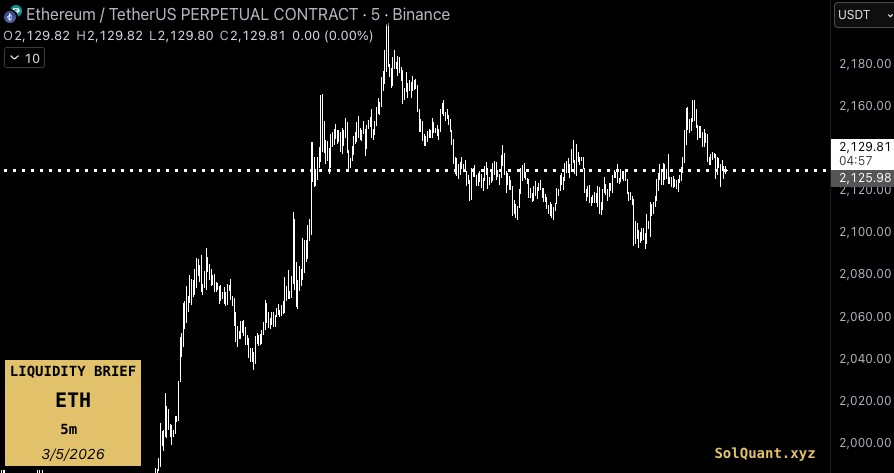
Liquidity Levels
Identifies high-probability liquidity zones where stop hunts and engineered moves originate. See exactly where the market is targeting before price ever gets there.
Markets are driven by the mechanics of the order book, not just sentiment. In crypto, price movements are often accelerated by liquidity cascades. When price hits a cluster of liquidation levels, the exchange is forced to execute automated “Market Sell” or “Market Buy” orders. This creates a feedback loop: one liquidation triggers the next, causing the price to “teleport” much further and faster than it would during organic trading.


trading strategies
Deep-dive into backtested performance across tokens, parameters, and market conditions. Full transparency on returns, drawdowns, and individual trades.
Mean Reversion MTF
Multi-timeframe Bollinger Band mean reversion with EMA trend filter, RSI, and ADX confirmation.
Smart Money Concepts
Order block and fair value gap strategy based on Smart Money Concepts with higher-timeframe structure filter.
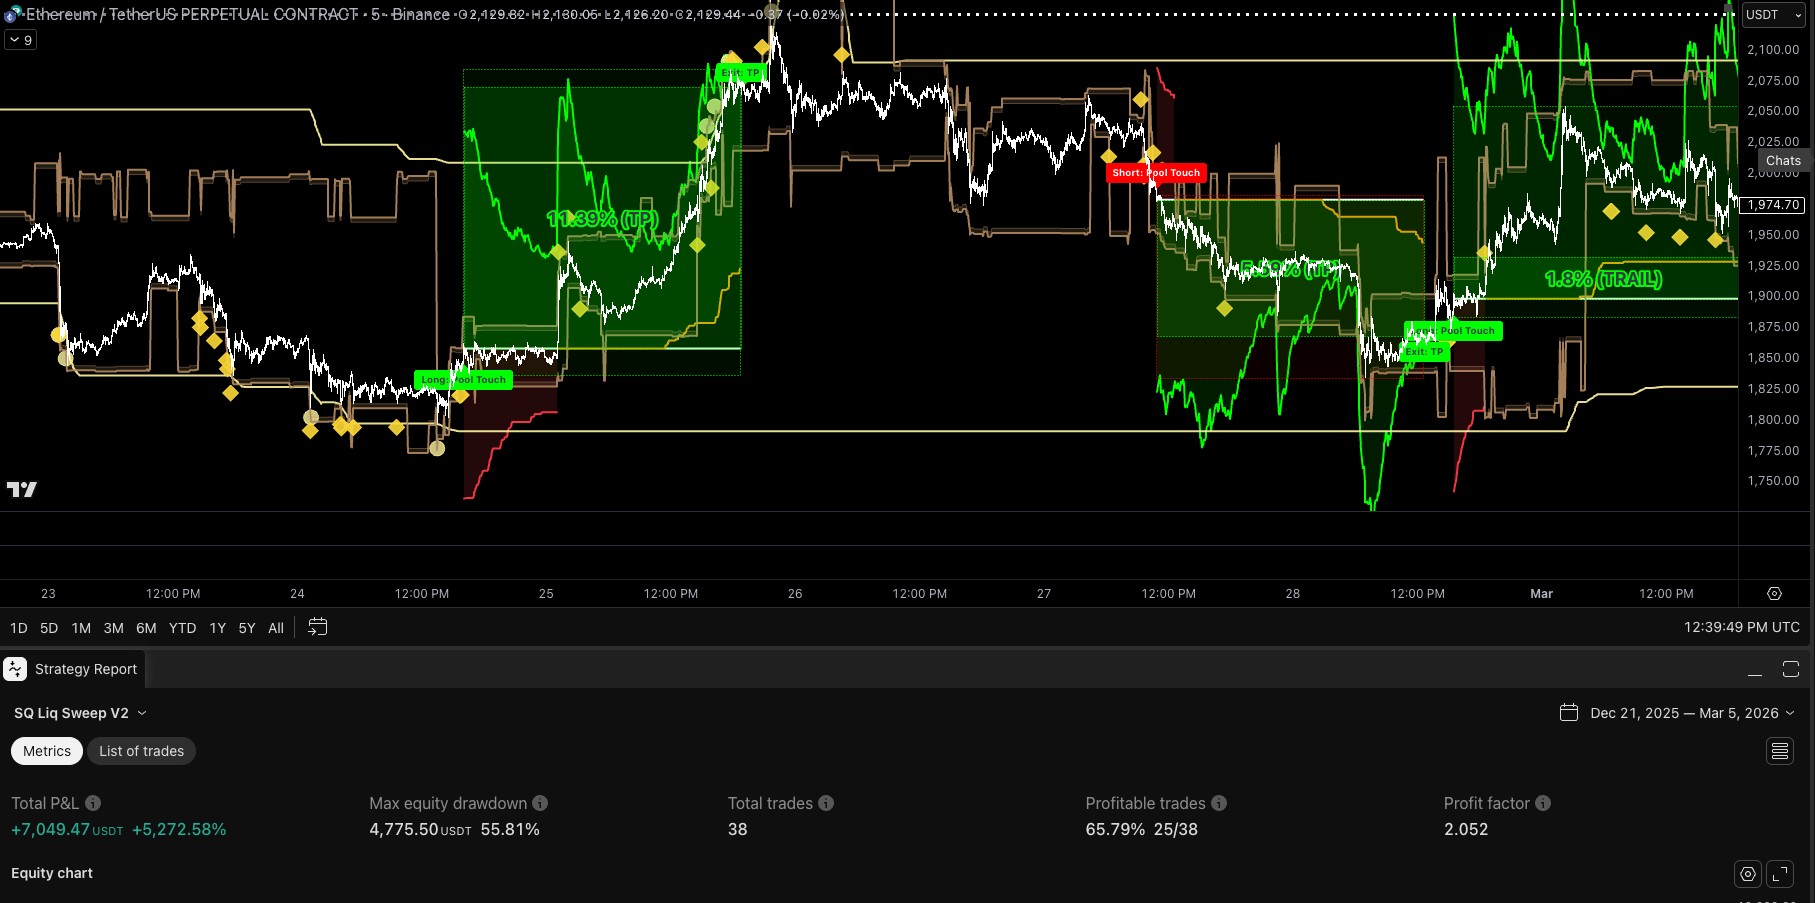
Liquidation Sweep
Trades liquidation level sweeps detected from open interest and volume spikes at leveraged price offsets.
choose your level. own your edge.
Every tier is built on the same core philosophy — show you the market's true structure, not lagging noise.
Trader$19.99/mo Subscribe via Whop Redirects to our secure Whop store. Subject to our Terms and Privacy Policy. | Pro Trader$39.99/mo Subscribe via Whop Redirects to our secure Whop store. Subject to our Terms and Privacy Policy. | Strategist$59.99/mo Subscribe via Whop Redirects to our secure Whop store. Subject to our Terms and Privacy Policy. | |
|---|---|---|---|
| Backtested Strategies | |||
| Liquidation Levels | |||
| Foundation TA | |||
| Trend MTF | |||
| WaveTrend Oscillator | |||
| WaveTrend Oscillator CVD-Z | |||
| HeikenAshi Trend | |||
| Synthetic Max Pain | |||
| PVSRA Volume Trend | |||
| Community Library |
what traders are saying
From day traders to systematic strategists — here's what the SolQuant edge looks like in practice.
ngl these volume structure tools hit different. been trading 2 years and never understood order flow until now. entry game is completely different 📈
liq heatmap is insane fr. stopped being exit liquidity the second i started using it. you can literally see the traps before you walk into them iykyk
tried every indicator suite on tradingview. solquant is the first that actually shows the market skeleton — the hidden structure moving price. worth every cent no cap
backtested signals gave me the edge to actually trust my system and stop second-guessing every entry. discipline up, pnl followed. simple as that
went from breakeven grinder to actually profitable in ~3 months using the pro suite. liq + volume combo is genuinely unmatched in volatile conditions ser
the indicators actually stack together as a system instead of random overlays fighting each other. this is what professional retail tooling looks like fr fr
used to get wicked out at key levels constantly. now i see the stop clusters before price touches them. trading with the algo not against it. changed everything
education library alone justified the sub. knowing WHY the indicators work > blindly using them. solquant actually teaches the logic. rare for a tooling product
5 years in crypto. strategist suite is the first thing that made me feel like i actually understand structural price movement at a deep level. gm to actually printing
lab
Internal research, upcoming releases, and platform updates.
We Tested Exogenous Signals. Here's What Actually Works.
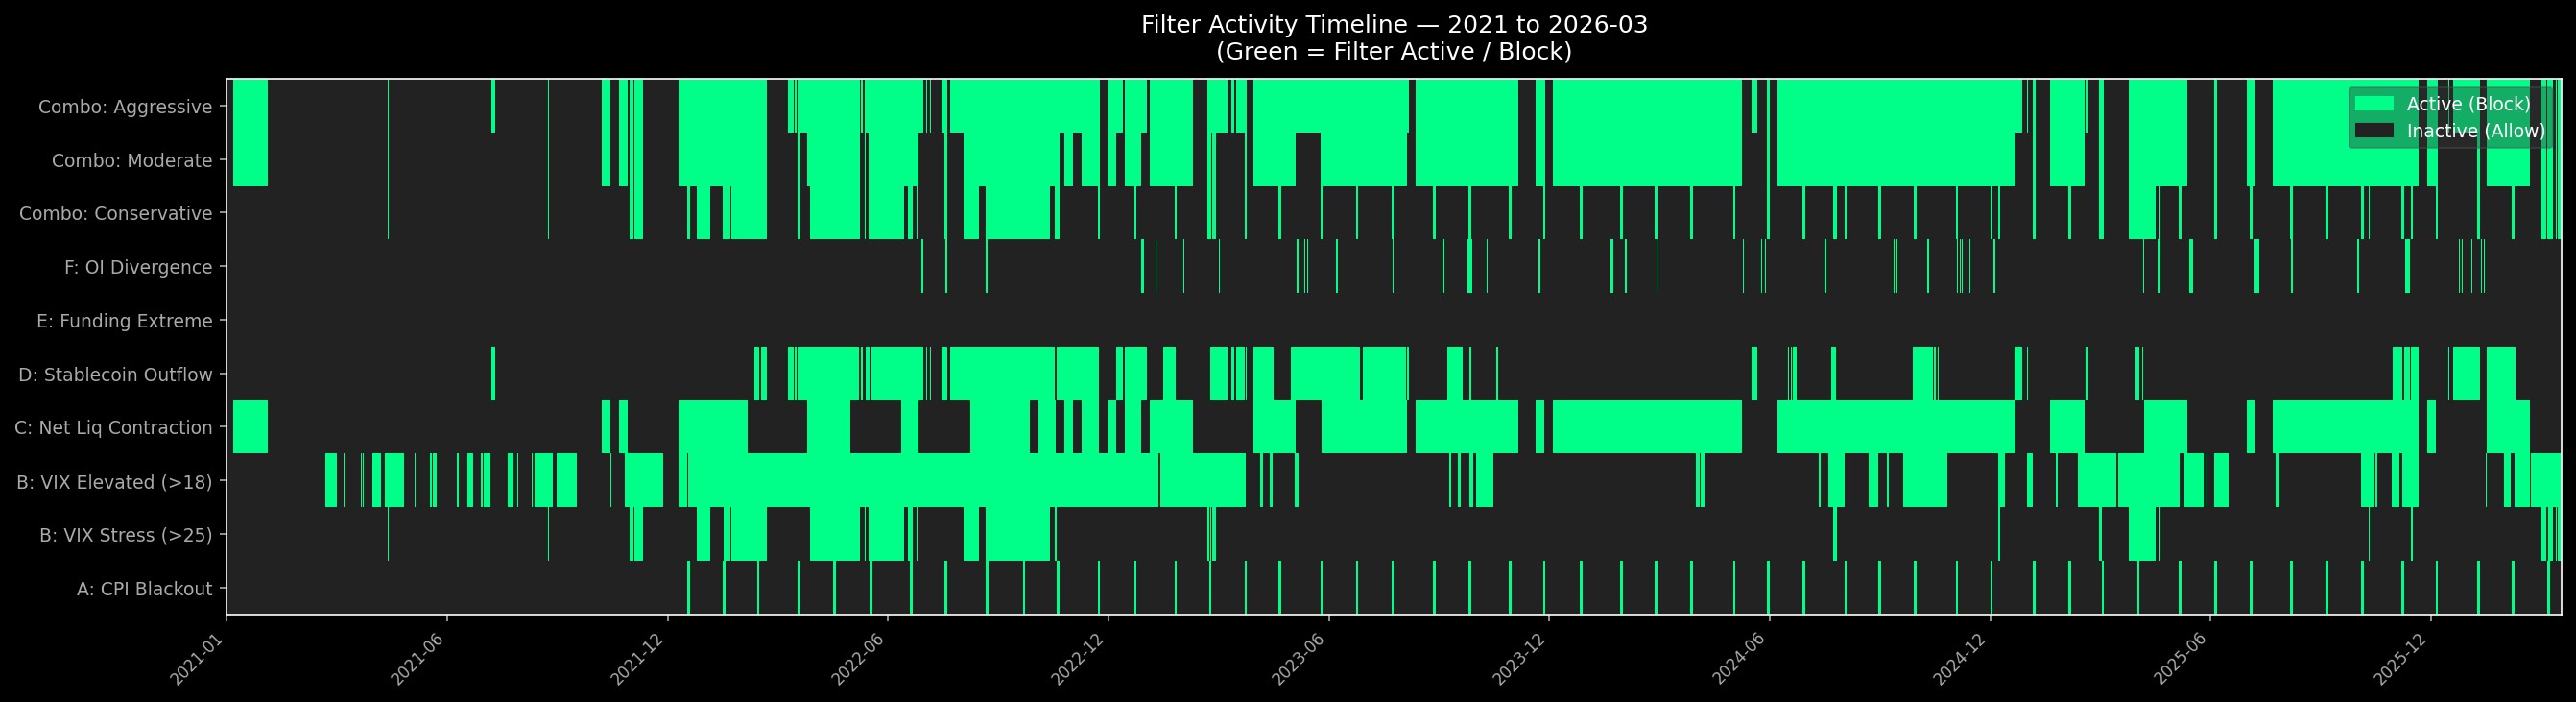
In our last post, we identified a Minimal Signal Set — Net Liquidity, VIX, stablecoin momentum, OI divergence — that appeared to carry meaningful information about Bitcoin's forward behavior. The question we left open was the only one that matters: do these signals selectively predict losing trades, and can blocking those trades improve real strategy performance?
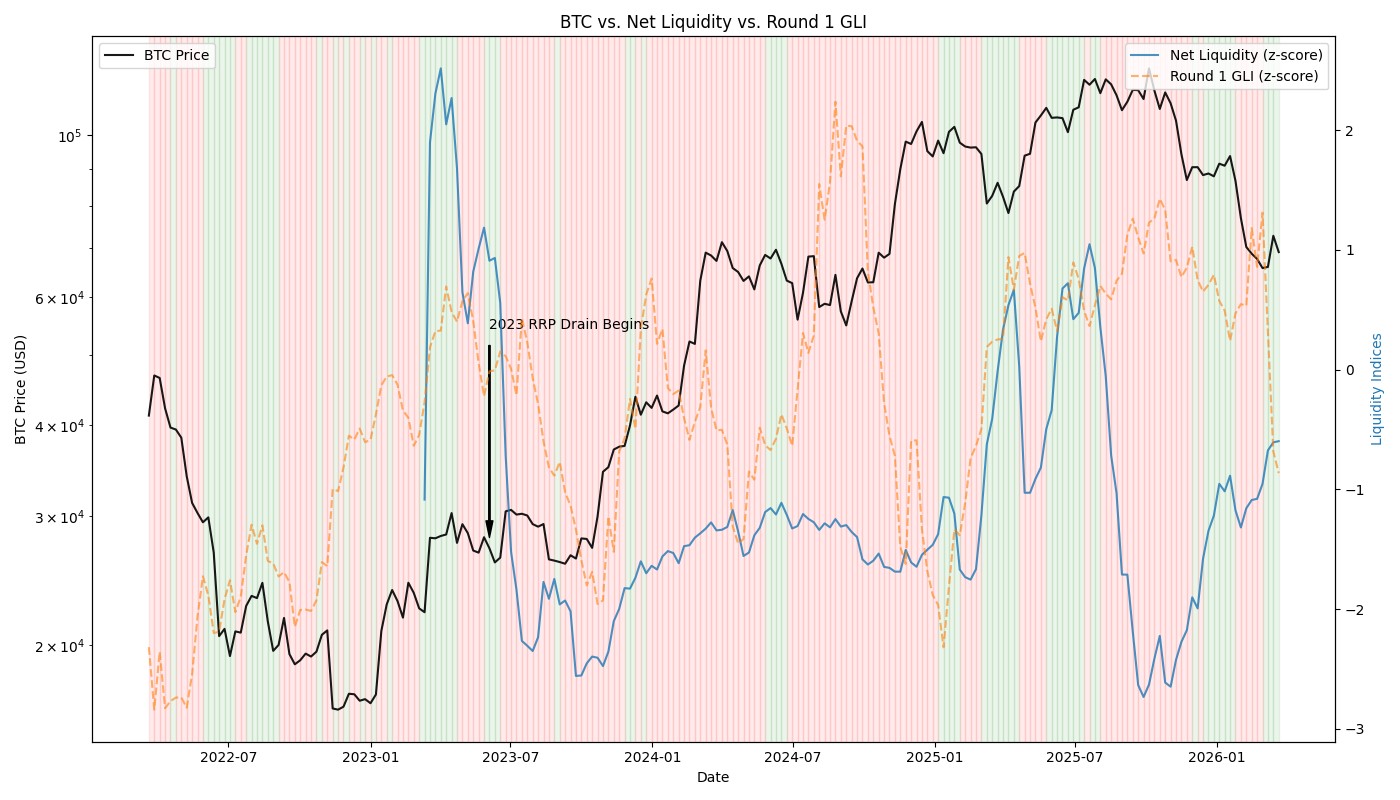
Beyond the Chart: Fusing Macro Liquidity and Crypto-Native Signals
As quantitative traders, it's easy to get tunnel vision looking only at price and volume. We recently stepped back to conduct a comprehensive, two-part research study on exogenous signals—data strictly outside of the core asset's technicals. Our goal was simple: Is there statistically meaningful, tradeable correlation between macro/crypto-native data and Bitcoin's price behavior?
Strategies are Coming
Results from our custom backtester have been coming in and we’ve been hard at work eliminating repainting and data leaks to make these strategies true to real time results and double checking over fitment. We will be offering these to our subscribers very soon!
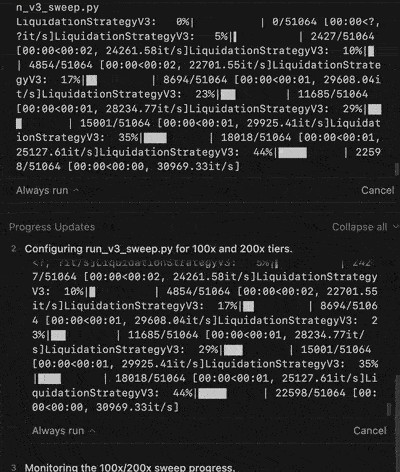
Backtesting strategies
We've been running backtests on our indicators and testing strategies on years of data on $BTC, $ETH, $SOL and many others. It's been a busy couple of weeks. Announcements are coming soon!
the community library
Start with our free "Lite" tools to understand the SolQuant edge before stepping into the Inner Circle.
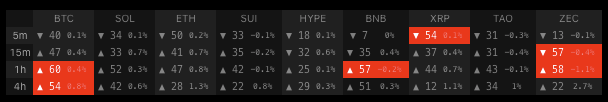
WaveTrend Dashboard
Scan momentum across every symbol and timeframe without switching charts.
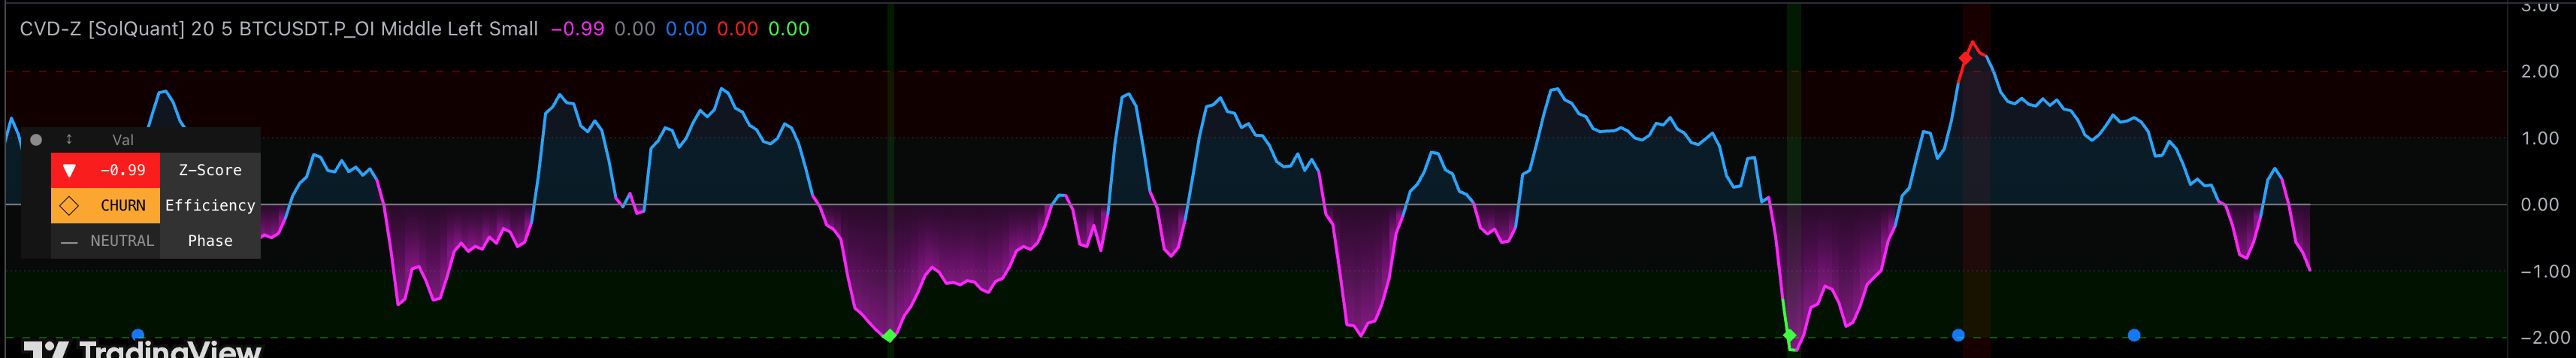
CVD Z-Score
Is the buying real? CVD Z-Score tells you when volume is statistically significant.
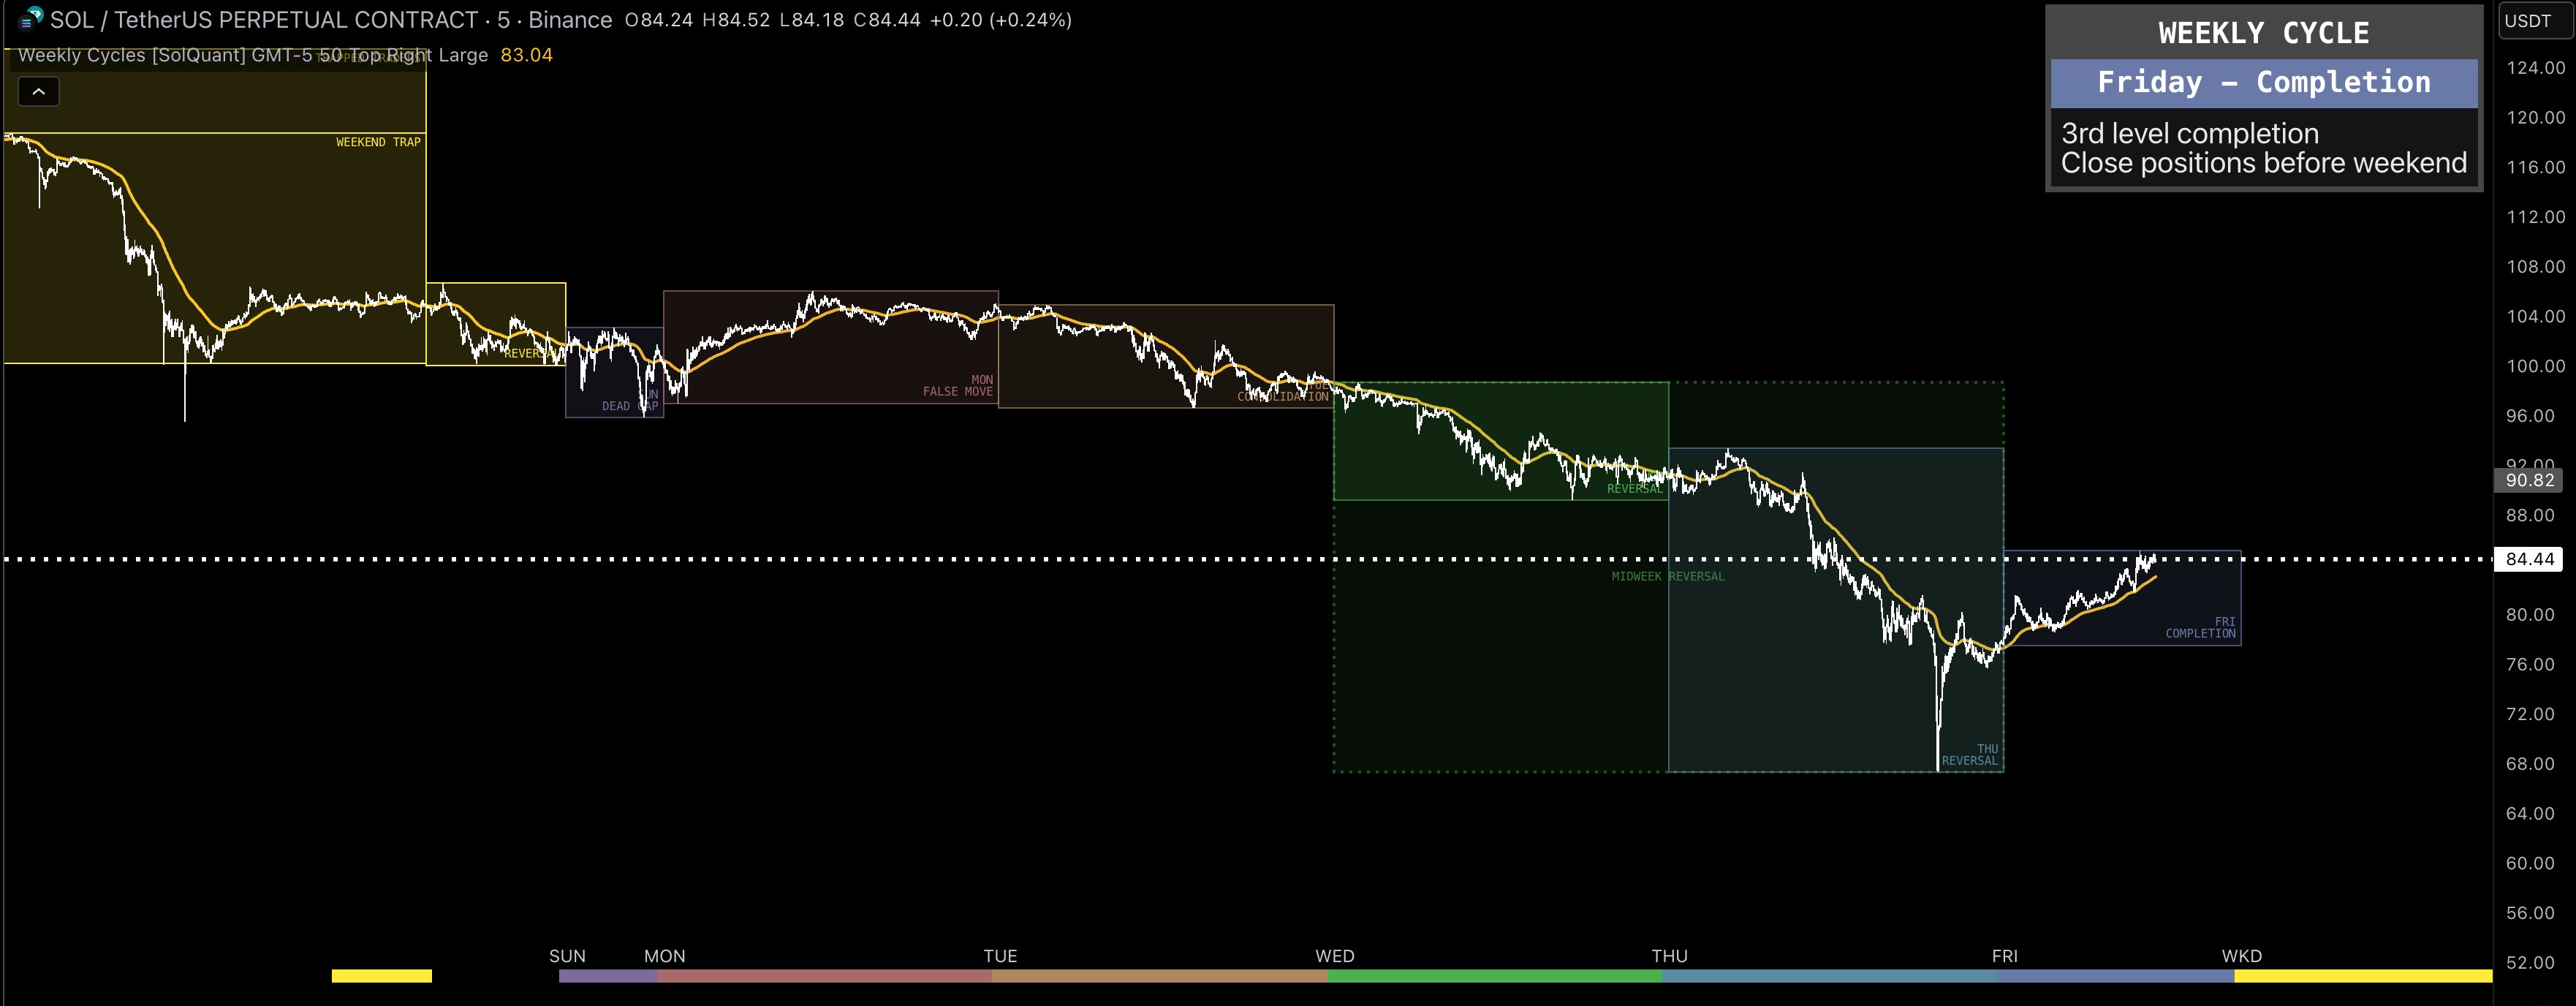
Weekly Cycles
The market has a weekly rhythm. Here's how to trade it.
Watermark
Your chart. Your brand. Clean and professional.
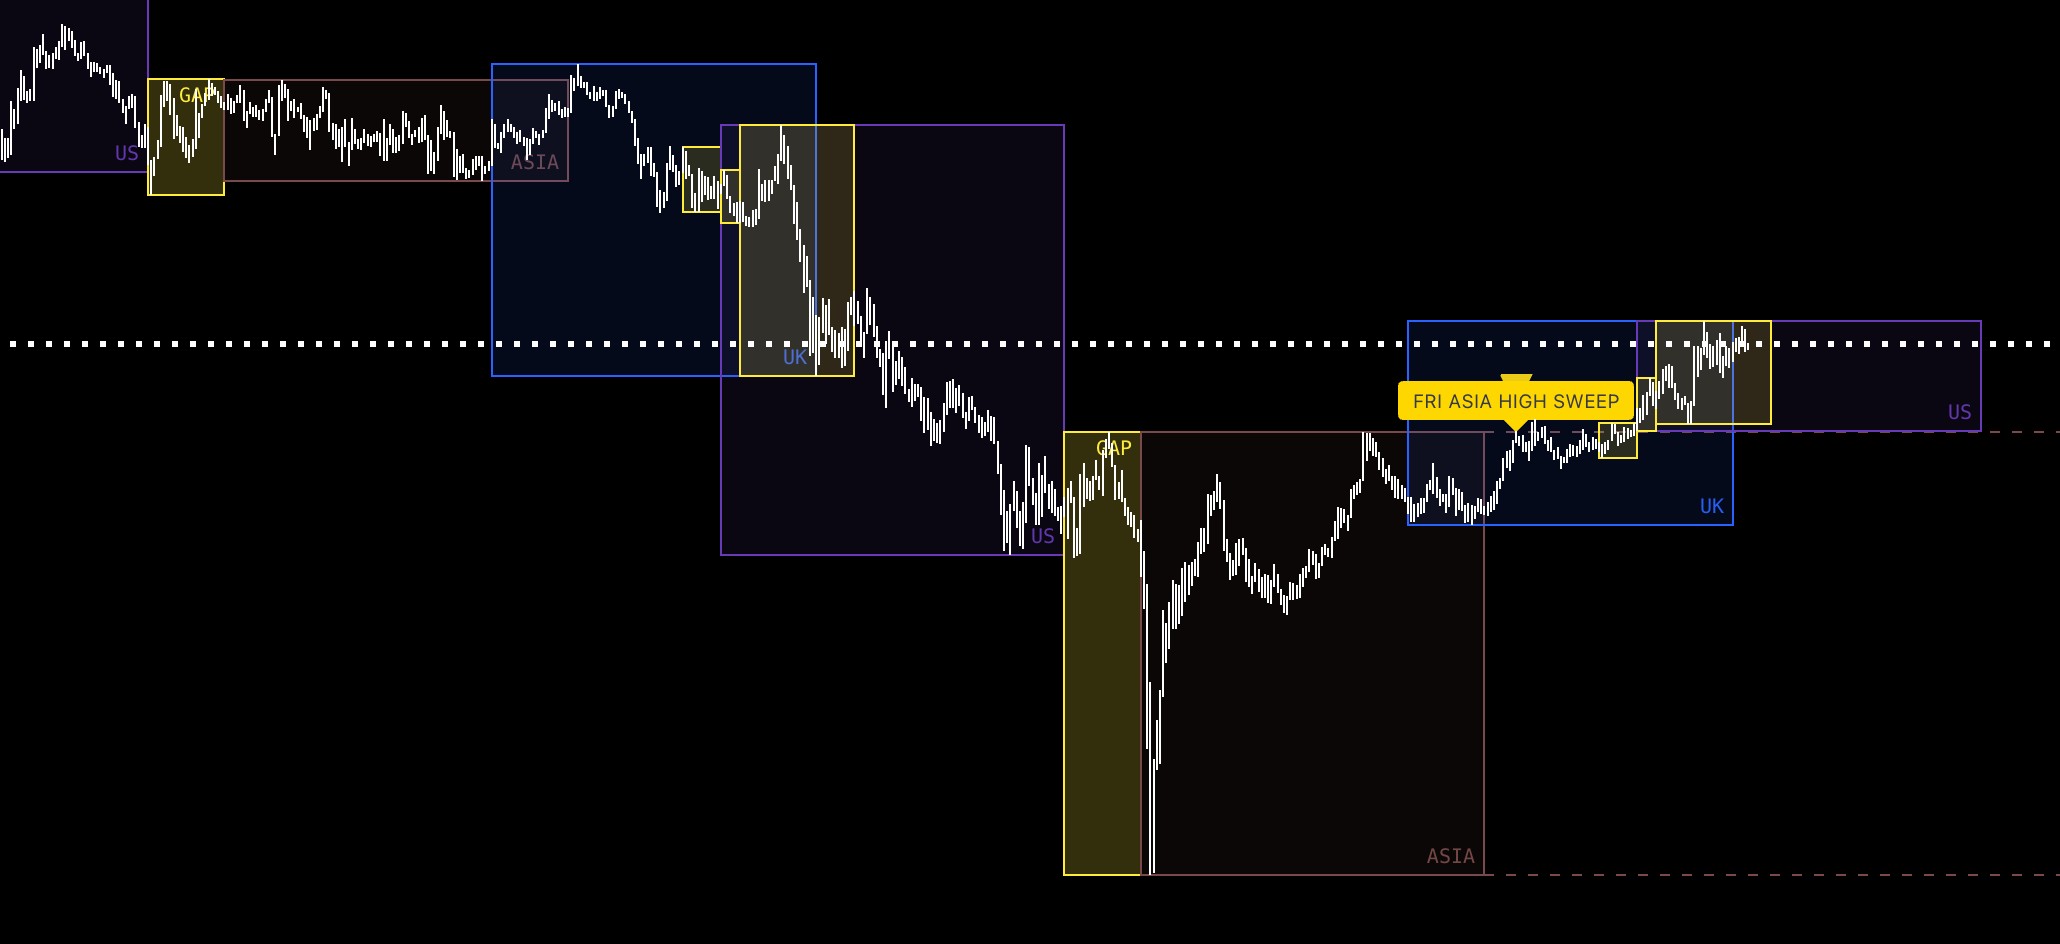
Markets
Know when London opens, New York wakes up, and the market makers go hunting.
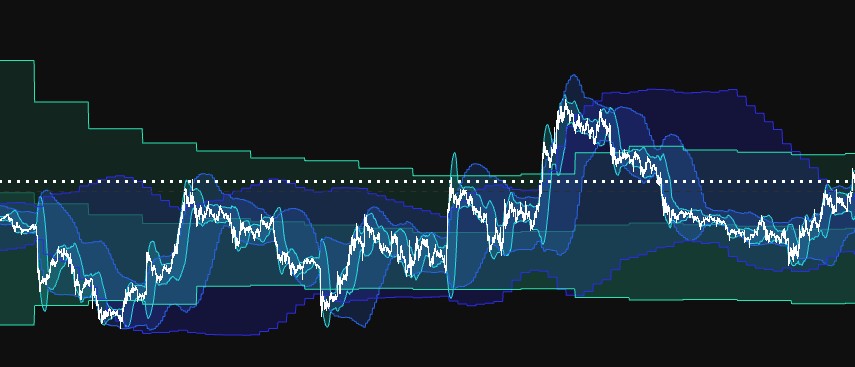
Bollinger MTF
One Bollinger Band shows volatility on one timeframe. This stacks them across multiple timeframes simultaneously so you see the squeeze before it fires.
who we are
We're systems architects, not hedge fund bros. SolQuant was born because retail technical analysis is often broken. We build high-precision tools for traders who are tired of basic RSI and want to see the market's 'wireframe' — the hidden structure of volume and time that dictates where price goes next. more...
frequently asked questions
Everything you need to know about the SolQuant suite.