CVD Z-Score

CVD Z-Score

Category: Community

🔗 Open on TradingView
Notion Data

The CVD Z-Score indicator measures cumulative buying versus selling pressure, normalized as a statistical z-score, to detect volume-price divergences and accumulation/distribution phases. It displays a smoothed oscillator that highlights when volume delta reaches statistical extremes, identifies effort-versus-result efficiency, and flags potential spot accumulation setups where rising CVD coincides with flat price action and declining open interest.


USAGE

Reading the Z-Score Oscillator

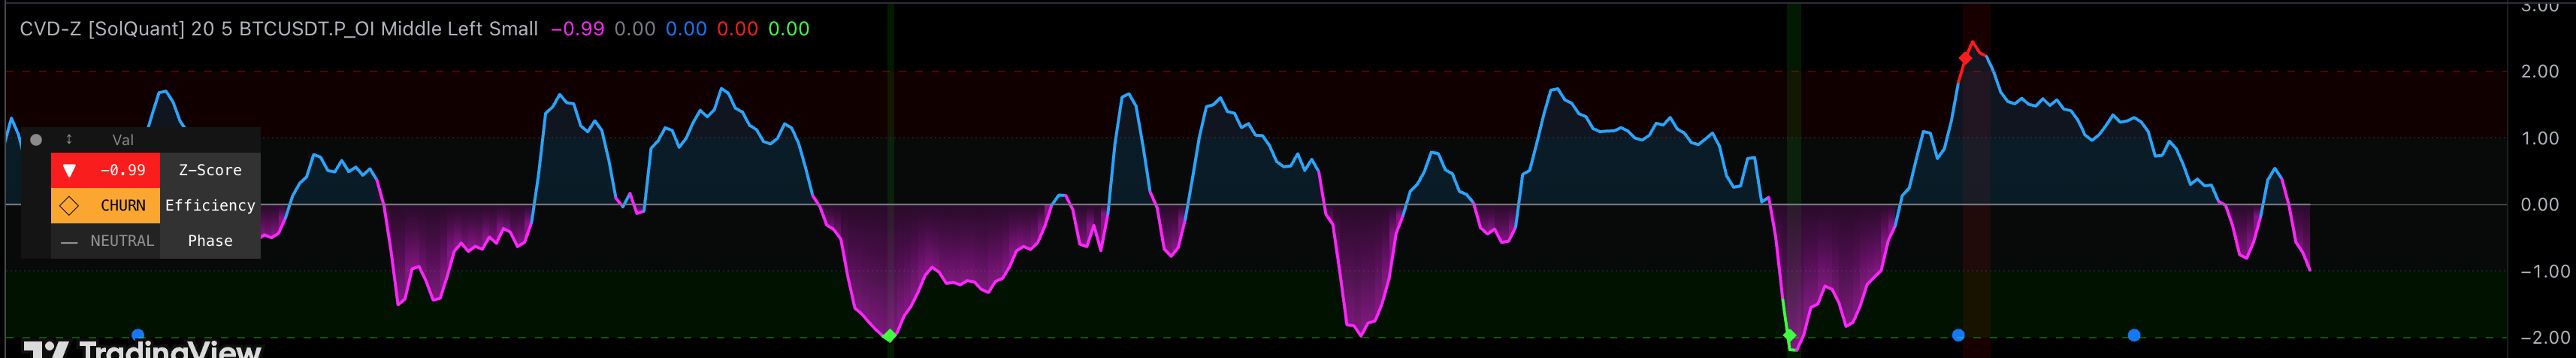
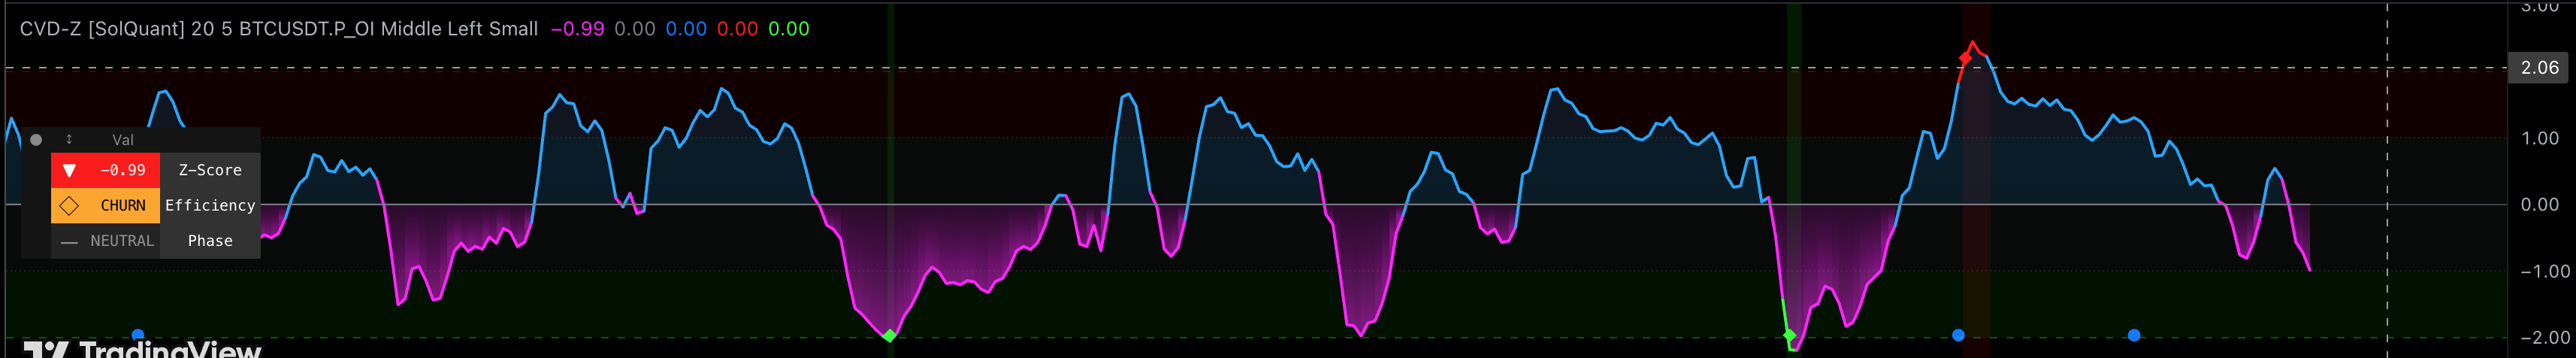
The main line oscillates around zero.

  • Positive values: Net buying pressure is above its recent average.
  • Negative values: Net selling pressure is dominant.
  • Colors: The line is blue when bullish and pink when bearish.
  • The neutral zone sits between +1.0 and -1.0. Values beyond ±1.0 indicate meaningful directional pressure, while values beyond ±2.0 are considered statistically extreme.

    Climax Zone Warnings

    When the Z-Score first crosses above +2.0 or below -2.0, a diamond marker appears. These climax entries indicate that buying or selling pressure has reached a statistical extreme—a condition that often precedes exhaustion or reversal. A subtle background highlight persists while the score remains in the extreme zone.

    Spot Accumulation Signals

    Blue circle markers appear at the bottom of the oscillator when three conditions align:

  • CVD Z-Score is positive and rising (buying pressure increasing).
  • Price action is flat (range is contained within 1.5x ATR).
  • Open Interest is declining (futures positions are unwinding).
  • This suggests buying is occurring in the spot market while futures traders reduce exposure—a classic accumulation pattern.

    Dashboard

    The optional dashboard displays three real-time metrics:

  • Z-Score: Current value with trend arrows and zone highlighting (Green for overbought, Red for oversold).
  • Efficiency: Categorizes the market as "Breakout" (price responding to volume), "Churn" (high volume, stalling price), or "Balanced."
  • Phase: Displays "Accumulation," "Climax," or "Neutral."

  • DETAILS

    CVD Calculation

    Cumulative Volume Delta (CVD) is built bar-by-bar:

  • Bullish bars (Close > Open): Full volume added to the total.
  • Bearish bars (Close < Open): Full volume subtracted.
  • Doji bars: Zero contribution.
  • Z-Score Normalization

    The raw CVD is standardized using the following formula: $$Z = \frac{CVD - SMA(CVD, n)}{\sigma(CVD, n)}$$ Where $n$ is the lookback period and $\sigma$ is the standard deviation. A smoothing EMA is then applied to reduce noise.

    Efficiency Analysis (Effort vs. Result)

    This compares price movement to CVD movement over a 5-bar window.

  • High Efficiency (> 5): "Breakout"—Price moves significantly relative to delta.
  • Low Efficiency (< 0.5): "Churn"—High delta activity but price is stalled, signaling absorption or distribution.
  • Open Interest Integration

    The indicator fetches OI data (default: BINANCE:BTCUSDT.P_OI). Declining OI during rising CVD and flat price suggests buying pressure stems from spot markets rather than leveraged futures.


    SETTINGS

    Z-Score Settings

  • Z-Score Lookback Period: SMA and Standard Deviation period (default: 20).
  • Smoothing Length (EMA): Period applied to the raw z-score (default: 5).
  • Data Source

  • OI Ticker: Symbol for Open Interest data. Ensure this matches the asset you are analyzing.
  • Signals

  • Show Spot Accumulation Signals: Toggle the blue circle markers.
  • Show Climax Zone Warnings: Toggle diamond markers and background highlights.
  • Dashboard

  • Show Dashboard: Toggle the info panel.
  • Dashboard Position/Size: Customize the visual placement and text scale.

  • 💡
    Disclaimer: This indicator measures statistical extremes in volume delta and does not predict price direction. Accumulation signals identify a specific pattern that does not guarantee a move. Climax events may not result in reversals. This is not financial advice; past performance does not guarantee future results.