Foundation TA
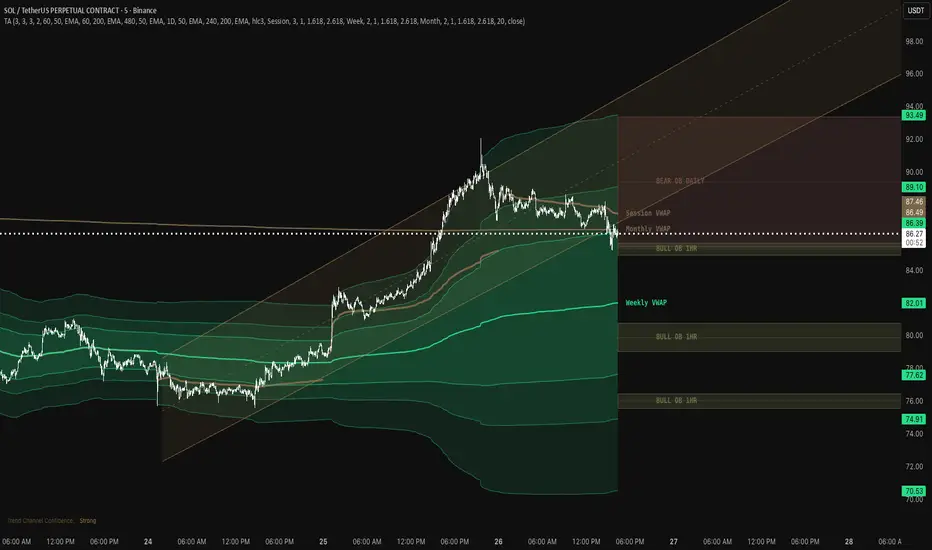
The Foundation TA indicator is a unified multi-component technical analysis overlay that integrates four interdependent analysis layers into a single tool: Volume-Pivot Order Blocks across four timeframes, Multi-Timeframe Moving Averages (six types), Multi-Anchor VWAP with standard deviation bands, and an Adaptive Trend Channel that automatically selects its optimal lookback period using Pearson's R correlation optimization.
Rather than stacking four separate indicators — consuming multiple TradingView slots and producing clashing visuals — this tool unifies them under a shared visual identity. The components function as an analytical hierarchy: the trend channel defines the macro regime, VWAP establishes institutional fair-value, order blocks identify entry/exit zones, and moving averages provide dynamic confirmation.
WHAT MAKES THIS ORIGINAL
1. Adaptive Trend Channel via Pearson's R Optimization
Standard channels use a fixed lookback. This indicator evaluates 19 different lookback periods in parallel (e.g., 100–1000 bars). It computes the Pearson correlation coefficient for each using a custom logarithmic regression and automatically selects the period with the strongest linear fit. This ensures the channel adapts to the dominant trend structure rather than a manual guess.
2. Volume-Pivot Order Block Detection
Unlike standard supply/demand indicators that mark every swing, this implementation requires two simultaneous conditions:
3. Cross-Component Unified Color Architecture
All components derive colors from a single centralized scheme (Default, Mono, or Blues). This eliminates visual noise, allowing the trader to read the chart as a single coherent layer rather than a mess of overlapping tools.
USAGE
Multi-Timeframe Order Blocks
Blocks are detected on the Current TF, 1-Hour, 4-Hour, and Daily charts simultaneously.
Multi-Timeframe Moving Averages
Display up to five MAs with independent settings for timeframe, length, and type (SMA, EMA, DEMA, VWMA, RMA, WMA). Labels clearly identify the settings (e.g., "EMA 200 | 4H") so you can track high-timeframe levels while trading a lower timeframe.
Multi-Anchor VWAP
Three VWAP calculations are available: Session, Weekly, and Monthly. Each includes up to three standard deviation bands. Transparency is applied at period boundaries to prevent "visual jumps" when the anchor resets.
Adaptive Trend Channel
Displays a logarithmic linear regression channel. A confidence table shows trend strength using Pearson's R, ranging from "Extremely Weak" to "Ultra Strong" (R > 0.98).
DETAILS
Order Block Detection Algorithm
Uses ta.pivothigh() on volume to find local maxima. An order block is only created when this volume peak aligns with a structural shift. The zone spans from the bar's HL2 to its extreme.
Pearson's R Regression Calculation
The indicator calculates the following for 19 test periods:
DEMA Calculation
The Double Exponential Moving Average is computed as: $$DEMA = 2 \times EMA(source, length) - EMA(EMA(source, length), length)$$ This significantly reduces lag compared to a standard EMA.
SETTINGS
| Category | Key Settings |
| Show | Color Scheme (Default, Mono, Blues), Master Toggles for all components. |
| Order Blocks | Bull/Bear colors, "Draw Right of Price Only" for cleaner charts. |
| MTF Blocks | Enable 1H, 4H, or Daily levels with custom counts. |
| MTF EMA | 5 slots with individual TF/Type/Length and Label toggles. |
| VWAP | Anchor periods (Session to Year), 3 StdDev bands, Weekly/Monthly toggles. |
| Trend Channel | Line style, Extend mode, and Midline transparency. |
METHODOLOGY
The source code is protected because it contains three complex implementations: