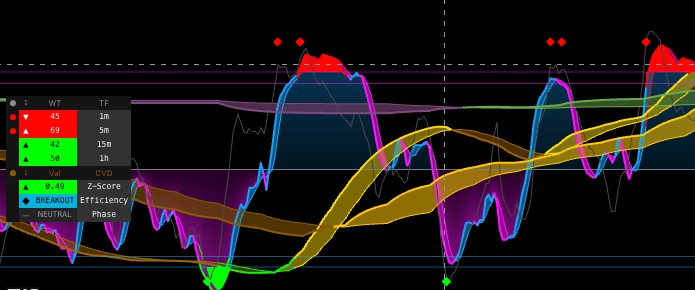
WaveTrend Oscillator CVD-Z
The WaveTrend Oscillator CVD-Z indicator fuses two independent analytical systems—a multi-timeframe WaveTrend oscillator and a Cumulative Volume Delta (CVD) Z-Score—into a single pane by scaling the CVD z-score into the WaveTrend's ±100 range.
This scale-mapping enables direct visual comparison between momentum extremes and volume-delta extremes on the same axis. It powers a combined signal system that fires only when a WaveTrend crossover after an extreme zone coincides with a CVD climax event within a defined temporal window.
WHAT MAKES THIS ORIGINAL
1. Z-Score to Oscillator Scale Mapping
The CVD Z-Score (ranging from approximately -3 to +3) is multiplied by a configurable scale factor (default: 30) and clamped to ±100. This maps it directly onto the WaveTrend range.
This alignment means that when both the CVD line and WaveTrend line enter the extreme zone simultaneously, two independent dimensions (momentum and volume-delta) confirm the same condition.
2. Temporal Windowed Combo Signal
The W+CVD combo signal requires two conditions within a 5-bar lookback window:
This window accounts for the natural lag between momentum shifts and volume-delta shifts. When a combo fires, smaller standalone signals are suppressed to keep the chart clean.
3. Effort-versus-Result Efficiency Metric
The dashboard classifies market states by comparing price movement to CVD movement ($| \Delta Price | / | \Delta CVD |$):
USAGE
Reading WaveTrend Signals
The oscillator displays two lines (WT1 and WT2) between +100 and -100.
Reading CVD Z-Score
The CVD Z-Score line tracks cumulative buying vs. selling pressure. A rising line shows increasing net buying pressure relative to recent history.
Special Markers
DETAILS
WaveTrend Calculation
CVD Z-Score Calculation
CVD is built bar-by-bar (Bullish bars add volume; Bearish subtract). The z-score normalizes this: $$Z = \frac{CVD - SMA(CVD, lookback)}{StDev(CVD, lookback)}$$
Spot Accumulation Detection
The "Accumulation" phase triggers when three conditions align:
SETTINGS
Main Chart Signals
WaveTrend & CVD
Multi-Timeframe
METHODOLOGY
The source code is protected to preserve the specific implementation of the z-score-to-oscillator mapping, the temporal windowed combo logic, the effort-versus-result efficiency classifier, and the spot accumulation detector. These integration techniques create analytical value beyond what individual WaveTrend and CVD components provide separately.