Synthetic Max Pain
The Synthetic Max Pain indicator adapts options max pain theory to perpetual futures and leveraged crypto markets by constructing a synthetic open interest model. Since TradingView does not provide strike-level open interest data for derivatives, this indicator generates a modeled strike ladder centered on each anchor period's opening price, distributes synthetic OI across strikes using a Gaussian (bell curve) distribution with configurable skew parameters, then applies standard option payoff calculations to identify the price levels where the most positioned capital would face maximum loss.
This approach — applying Gaussian-weighted synthetic OI modeling with option payoff mathematics to non-options markets — is an original analytical method. No standard open-source Pine Script indicator performs this calculation.
WHAT MAKES THIS ORIGINAL
1. Gaussian OI Distribution Modeling
The indicator generates a configurable number of strikes (default: 41) spaced at a configurable increment (or auto-calculated at ~1% of price). Rather than assuming uniform OI across strikes, it distributes modeled OI using a Gaussian (bell curve) function centered near the anchor price but offset from at-the-money to simulate realistic positioning patterns. An additional weighting boost is applied to slightly out-of-the-money strikes, where empirical positioning data shows retail and leveraged traders tend to cluster.
2. Put/Call Bias Skew Modeling
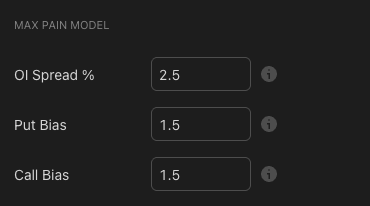
Two independent bias multipliers (Put Bias and Call Bias) allow the model to reflect directional market lean.
3. Multi-Anchor Simultaneous Calculation
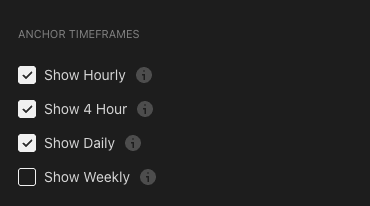
Four independent anchor timeframes (Hourly, 4-Hour, Daily, Weekly) each maintain their own strike ladder, OI distribution, and max pain calculation. Each resets when its anchor period begins, using that period's opening price as the new center. When multiple anchors produce levels at similar prices, the confluence identifies stronger zones.
4. Standard Option Payoff Applied to Synthetic Strikes
For each strike, the indicator computes:
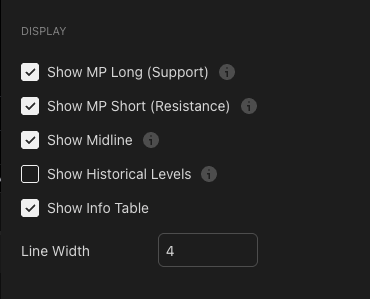
The strikes with peak weighted payoff above the anchor become MP Short (resistance); those below become MP Long (support). This is the same mathematics used in traditional max pain calculation, applied to synthetically generated data.
USAGE
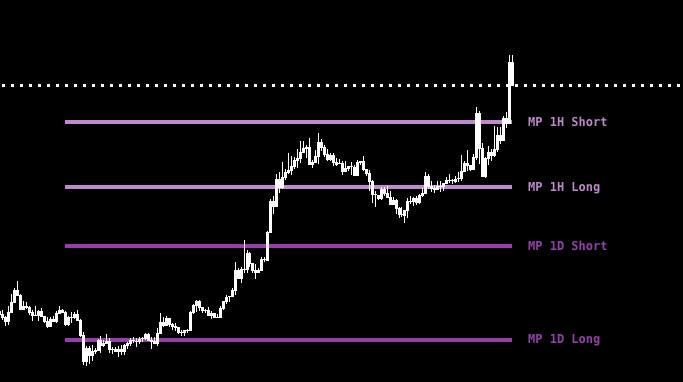
Reading Max Pain Levels
Two horizontal lines are displayed for each enabled anchor timeframe:
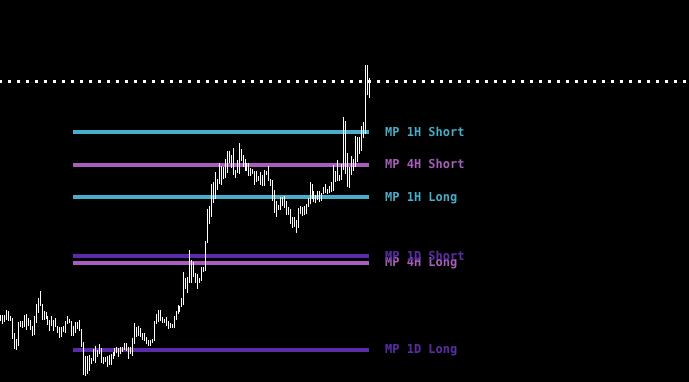
Multi-Timeframe Anchors
Four anchor timeframes can be enabled simultaneously. Shorter timeframes (Hourly) provide intraday levels; longer timeframes (Daily, Weekly) frame the broader structure. Confluence zones where levels from different anchors overlap tend to be stronger.
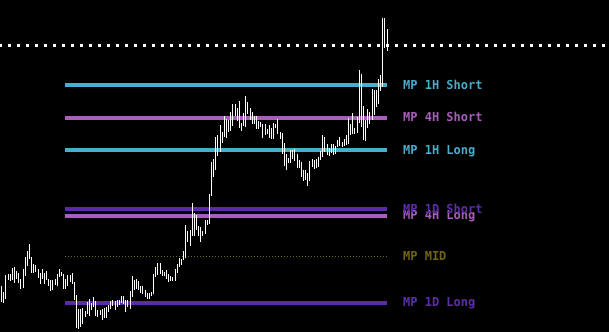
Midline
An optional midline plots the average of the primary timeframe's MP Long and MP Short, representing the theoretical equilibrium point.
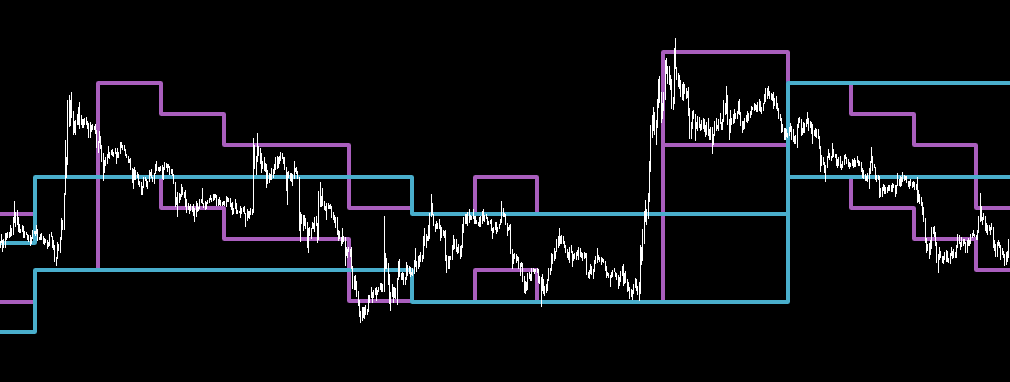
Historical vs Current Mode
Current mode (default) draws only the latest levels as horizontal lines. Historical mode plots levels as step lines across the full chart history, allowing analysis of how price has interacted with max pain levels over time.
DETAILS
Strike Ladder Construction
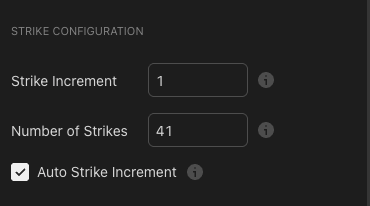
Strikes are generated at equal increments above and below the anchor price. The Auto Strike Increment option sets the increment to approximately 1% of the current price, adapting to the asset's scale (e.g., ~$1 for SOL, ~$500 for BTC).
Gaussian OI Distribution
Modeled OI is distributed across the strike ladder using a bell curve with standard deviation controlled by the OI Spread parameter. Lower spread values concentrate OI tightly around the anchor; higher values distribute it more widely. The distribution is offset from at-the-money by a fixed amount, with an additional boost factor applied to slightly OTM strikes.
Payoff Calculation
For each strike, standard call and put payoff functions are computed and weighted by the modeled OI at that strike. The search for MP Long scans strikes below the anchor for the one with maximum put-side weighted payoff. MP Short scans above for maximum call-side weighted payoff.
SETTINGS
Strike Configuration
Max Pain Model
Anchor Timeframes
Display
METHODOLOGY
The source code is protected because it contains the complete implementation of:
This synthetic OI modeling approach has no equivalent in open-source Pine Script libraries.