Weekly Cycles
Community

Weekly Cycles

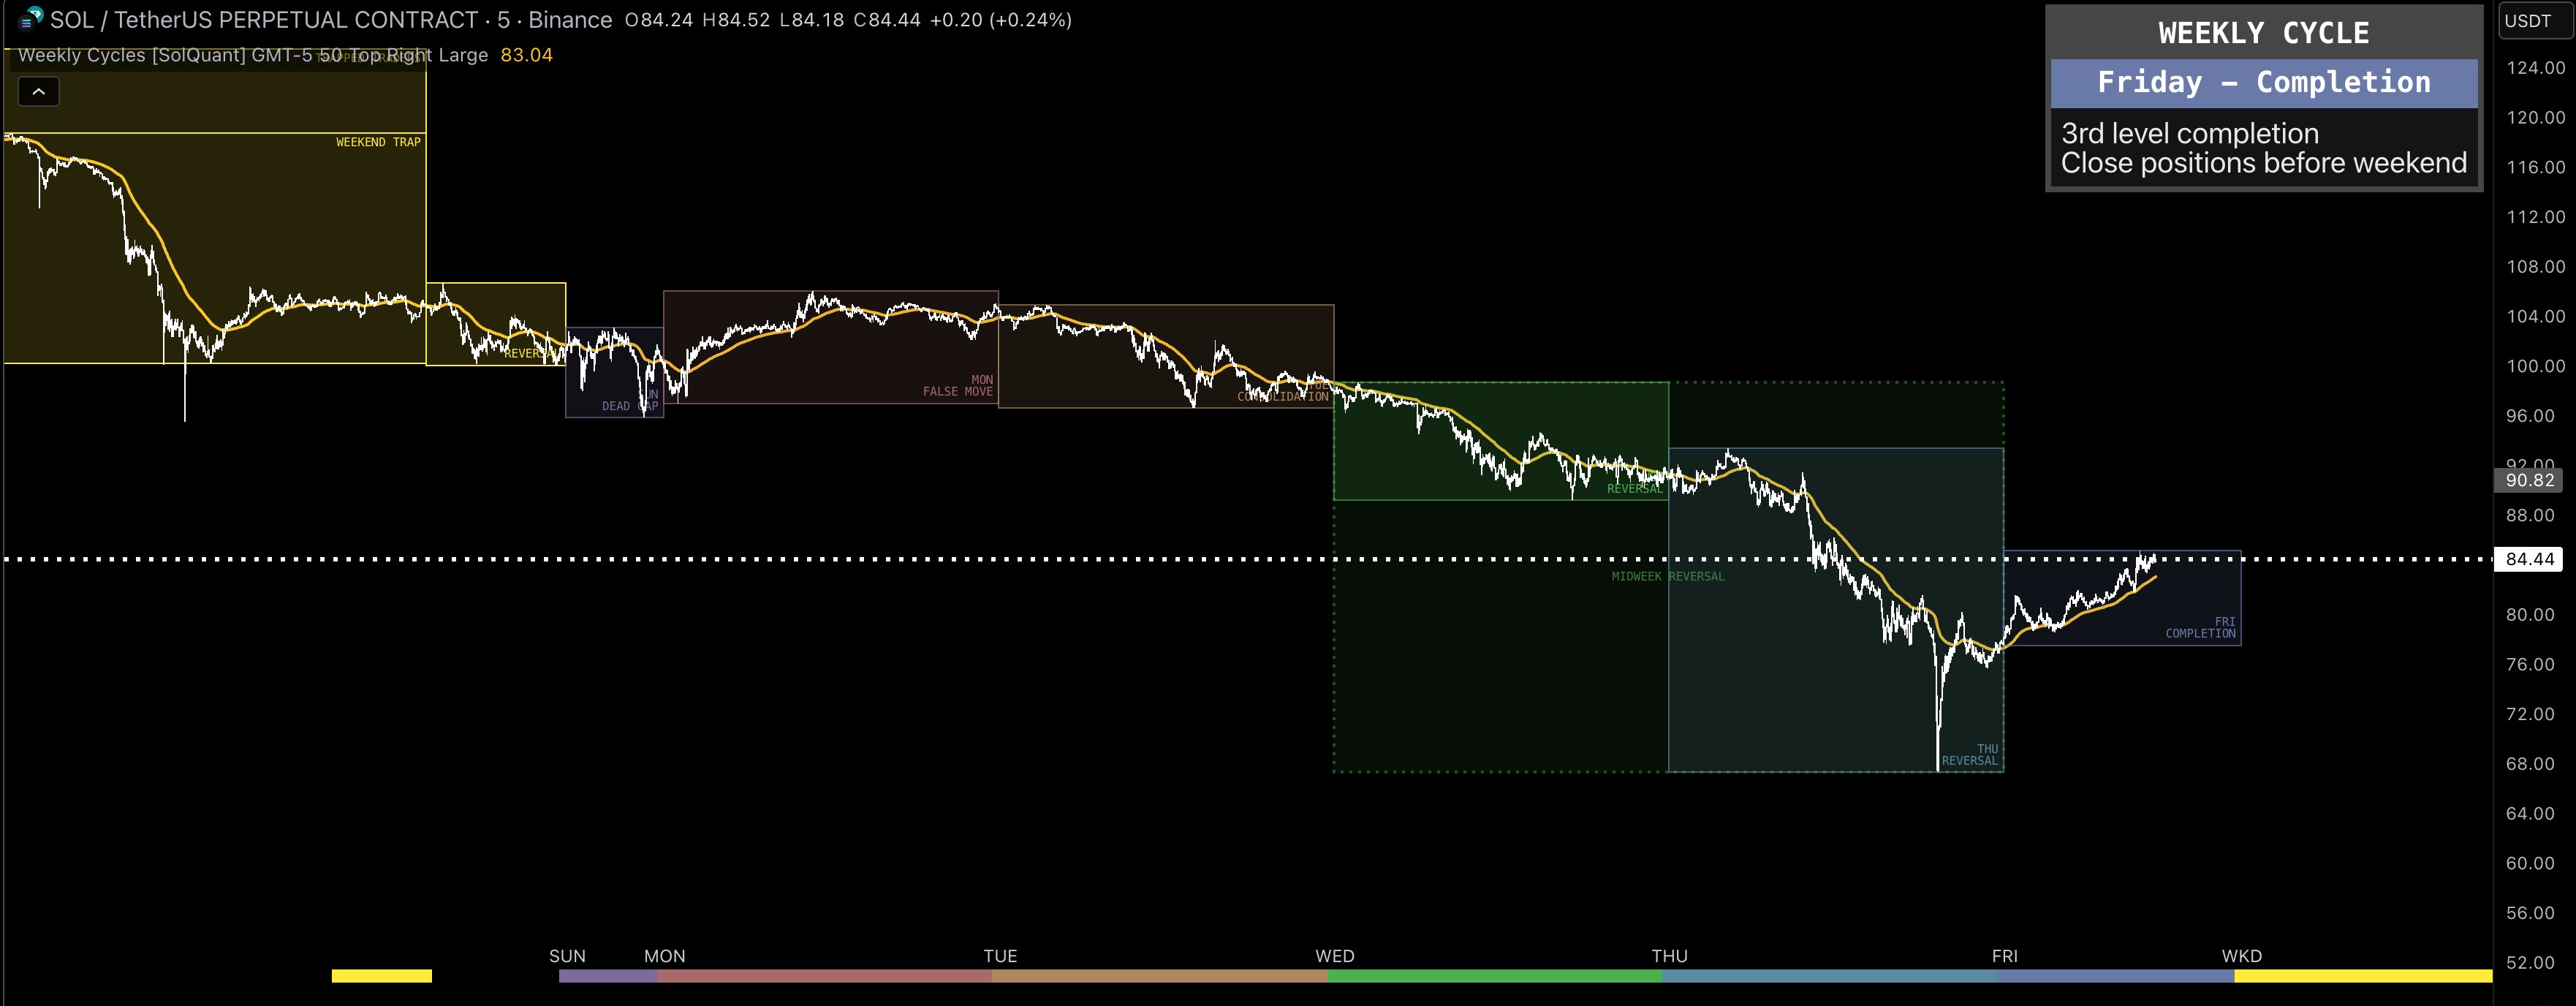
The Weekly Cycles indicator maps recurring weekly behavioral phases onto the chart using colored daily boxes and labels. It divides each week into distinct phases based on observed market patterns, providing structural context for intraweek trading decisions.


USAGE

Weekly Phases

Each day of the week is assigned a behavioral phase based on institutional and retail participation patterns:

  • Sunday — Dead Gap Zone: Low-liquidity period where gaps from the weekend close can create traps. Price action is often unreliable for directional bias.
  • Monday — False Move: The early-week move that frequently reverses. Monday often establishes a range extreme that gets swept later in the week.
  • Tuesday — Consolidation: A transition day where the market digests Monday's move and begins building structure for the week's main move.
  • Wednesday/Thursday — Midweek Reversal: The highest-probability window for the week's primary directional move. This is often where the "true trend" establishes itself.
  • Friday — Model Completion: The closing phase where weekly targets are met or the move stalls. Profit-taking and position squaring are common.
  • Saturday — Weekend Trap: Low-liquidity continuation of Friday's action that can create misleading signals for the following week.
  • Visual Display

    Each phase is represented by a colored box spanning the day's price range. Labels at the top of each box display the phase name for quick reference. The boxes update in real-time as each day's high and low develop.


    DETAILS

    The indicator uses the built-in dayofweek function to assign phases. Box boundaries are defined by:

  • Time: From each day's opening time through the next day's opening.
  • Price: Tracking the highest high and lowest low of all bars within that specific 24-hour window.
  • Historical boxes are maintained up to a configurable maximum count, ensuring the chart remains performant while allowing for back-analysis of previous weekly cycles.


    SETTINGS

  • Show Phase Labels: Toggle the text labels (e.g., "Midweek Reversal") above each daily box.
  • Phase Colors: Fully customizable colors for each individual day/phase to match your chart theme.
  • Max Boxes: Controls the history length by limiting how many historical daily boxes are rendered.

  • 💡
    Disclaimer: Weekly cycle phases are based on observed market patterns and do not guarantee that price will follow the described behavior in any given week. Market conditions vary; phases should be used as context, not as standalone signals. This indicator does not constitute financial advice.