HeikenAshi Trend
The HeikenAshi Trend indicator displays smoothed Heikin-Ashi candles as a trend overlay with optional multi-timeframe layers. By applying double EMA smoothing to Heikin-Ashi calculations, it filters out market noise to reveal the underlying trend direction with clarity.
Standard Heikin-Ashi candles already smooth price data by averaging, but they can still produce whipsaws in choppy markets. This indicator adds two layers of exponential smoothing—first on the raw OHLC data, then on the resulting HA values—creating a clean trend ribbon that changes color only on meaningful trend shifts.
USAGE
Reading the Trend Ribbon
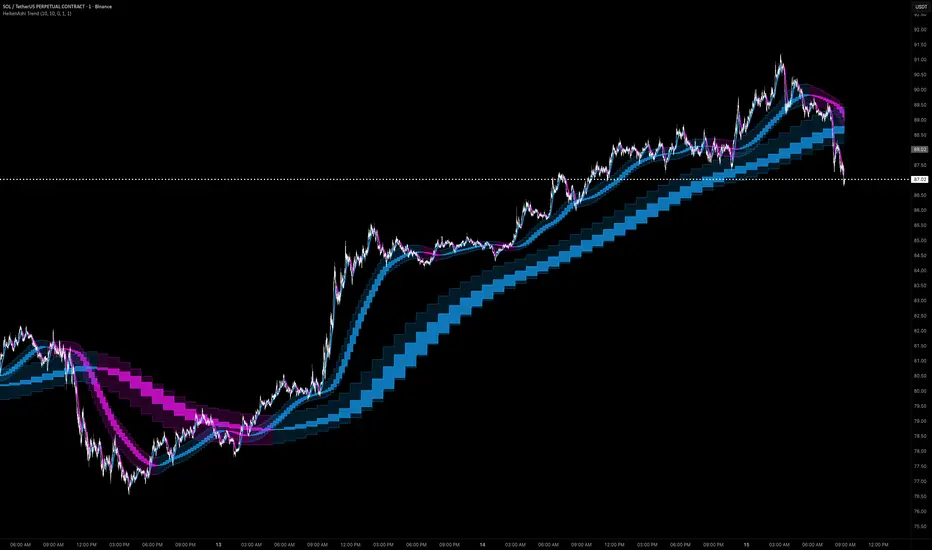
The indicator draws a filled "ribbon" representing the smoothed Heikin-Ashi candle body.
The body fill uses a semi-transparent color, while the wick range is filled with a lighter shade, creating a layered visual effect. Color changes represent confirmed trend shifts after the double smoothing has absorbed enough price data, eliminating most false signals.
Multi-Timeframe Overlays
Two higher timeframe overlays are available: 15-minute and 1-hour. When enabled, each draws its own smoothed HA ribbon on the chart.
For example, on a 1-minute chart:
When all three agree, the setup carries higher conviction. Each MTF overlay includes its own smoothing parameter to control how quickly higher timeframe data adapts to the lower timeframe chart.
Optional Raw Candles
A Show Candles toggle displays the actual smoothed HA candle bodies and wicks alongside the ribbon fills for traders who prefer a traditional candlestick format.
DETAILS
Double Smoothing Process
The calculation follows a three-step pipeline:
This approach significantly reduces lag compared to using very long single-pass smoothing while achieving comparable noise reduction.
Multi-Timeframe Data
Higher timeframe HA values are fetched using request.security() and then optionally smoothed with an additional EMA on the current timeframe. This prevents the "staircase" effect common with raw MTF data.
SETTINGS
Main Settings
Multi-Timeframe
METHODOLOGY
This indicator employs a proprietary double-smoothing pipeline that applies two independent EMA passes to Heikin-Ashi transformed data. The multi-timeframe integration uses proprietary adaptive smoothing parameters per MTF layer to control visual transition between higher timeframe candle updates. The ribbon fill system uses proprietary transparency and layering logic for body versus wick visualization. Source code protection preserves the integrity of these proprietary smoothing and visualization calculations.