Liquidation Levels
Strategic Value of the Indicator
The Mechanics of Liquidity
Markets are driven by the mechanics of the order book, not just sentiment. In crypto, price movements are often accelerated by liquidity cascades.
When price hits a cluster of liquidation levels, the exchange is forced to execute automated "Market Sell" or "Market Buy" orders. This creates a feedback loop: one liquidation triggers the next, causing the price to "teleport" much further and faster than it would during organic trading.
Market Maker Behavior and "Toxic Flow"
Professional liquidity providers, or Market Makers, aim to stay delta-neutral. When a cascade starts, they recognize "toxic flow"—one-sided, forced orders that increase their inventory risk.
To protect themselves, they often "quote wider" or pull their limit orders entirely. This sudden removal of liquidity is why price seems to "slip" through levels without any meaningful resistance until the cascade is exhausted.
Why This Indicator Works
The Liquidation Levels indicator maps these hidden clusters in the order book. Instead of guessing where support might be based on lagging patterns, you can see the exact price levels where a chain reaction is mathematically likely to occur.
By tracking these levels, you are trading the structural reality of the market rather than historical price action.
The Liquidation Levels indicator maps estimated liquidation price zones for leveraged positions across five tiers (10x, 25x, 50x, 100x, 200x). By analyzing volume spikes, open interest changes, and cumulative volume delta, it identifies bars where significant positioning activity occurred and projects corresponding liquidation prices above and below the market.
Unlike simple fixed-percentage bands, this tool uses statistical thresholds (standard deviations above a rolling mean) to detect meaningful activity. The result is a dynamic map of unclaimed liquidity that updates as levels are "filled" by price action.
Usage
Reading Liquidation Levels
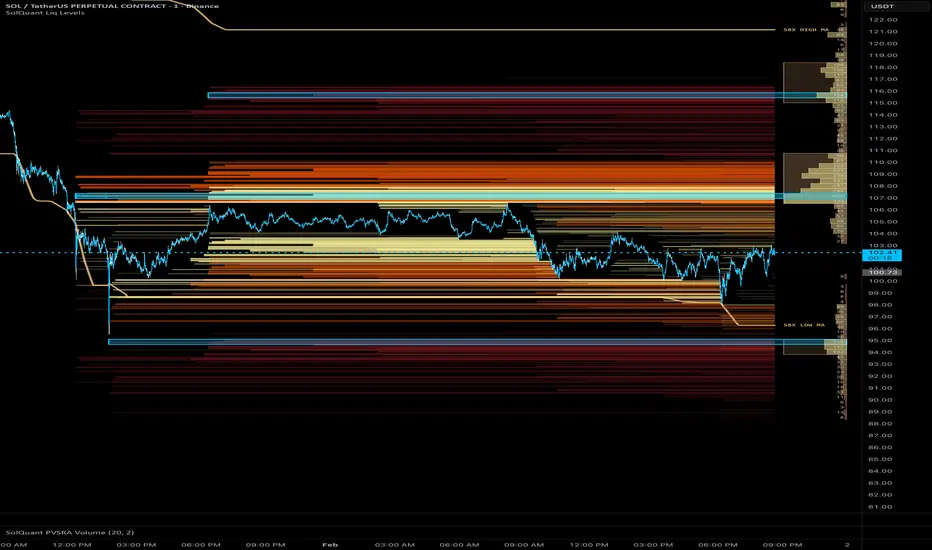
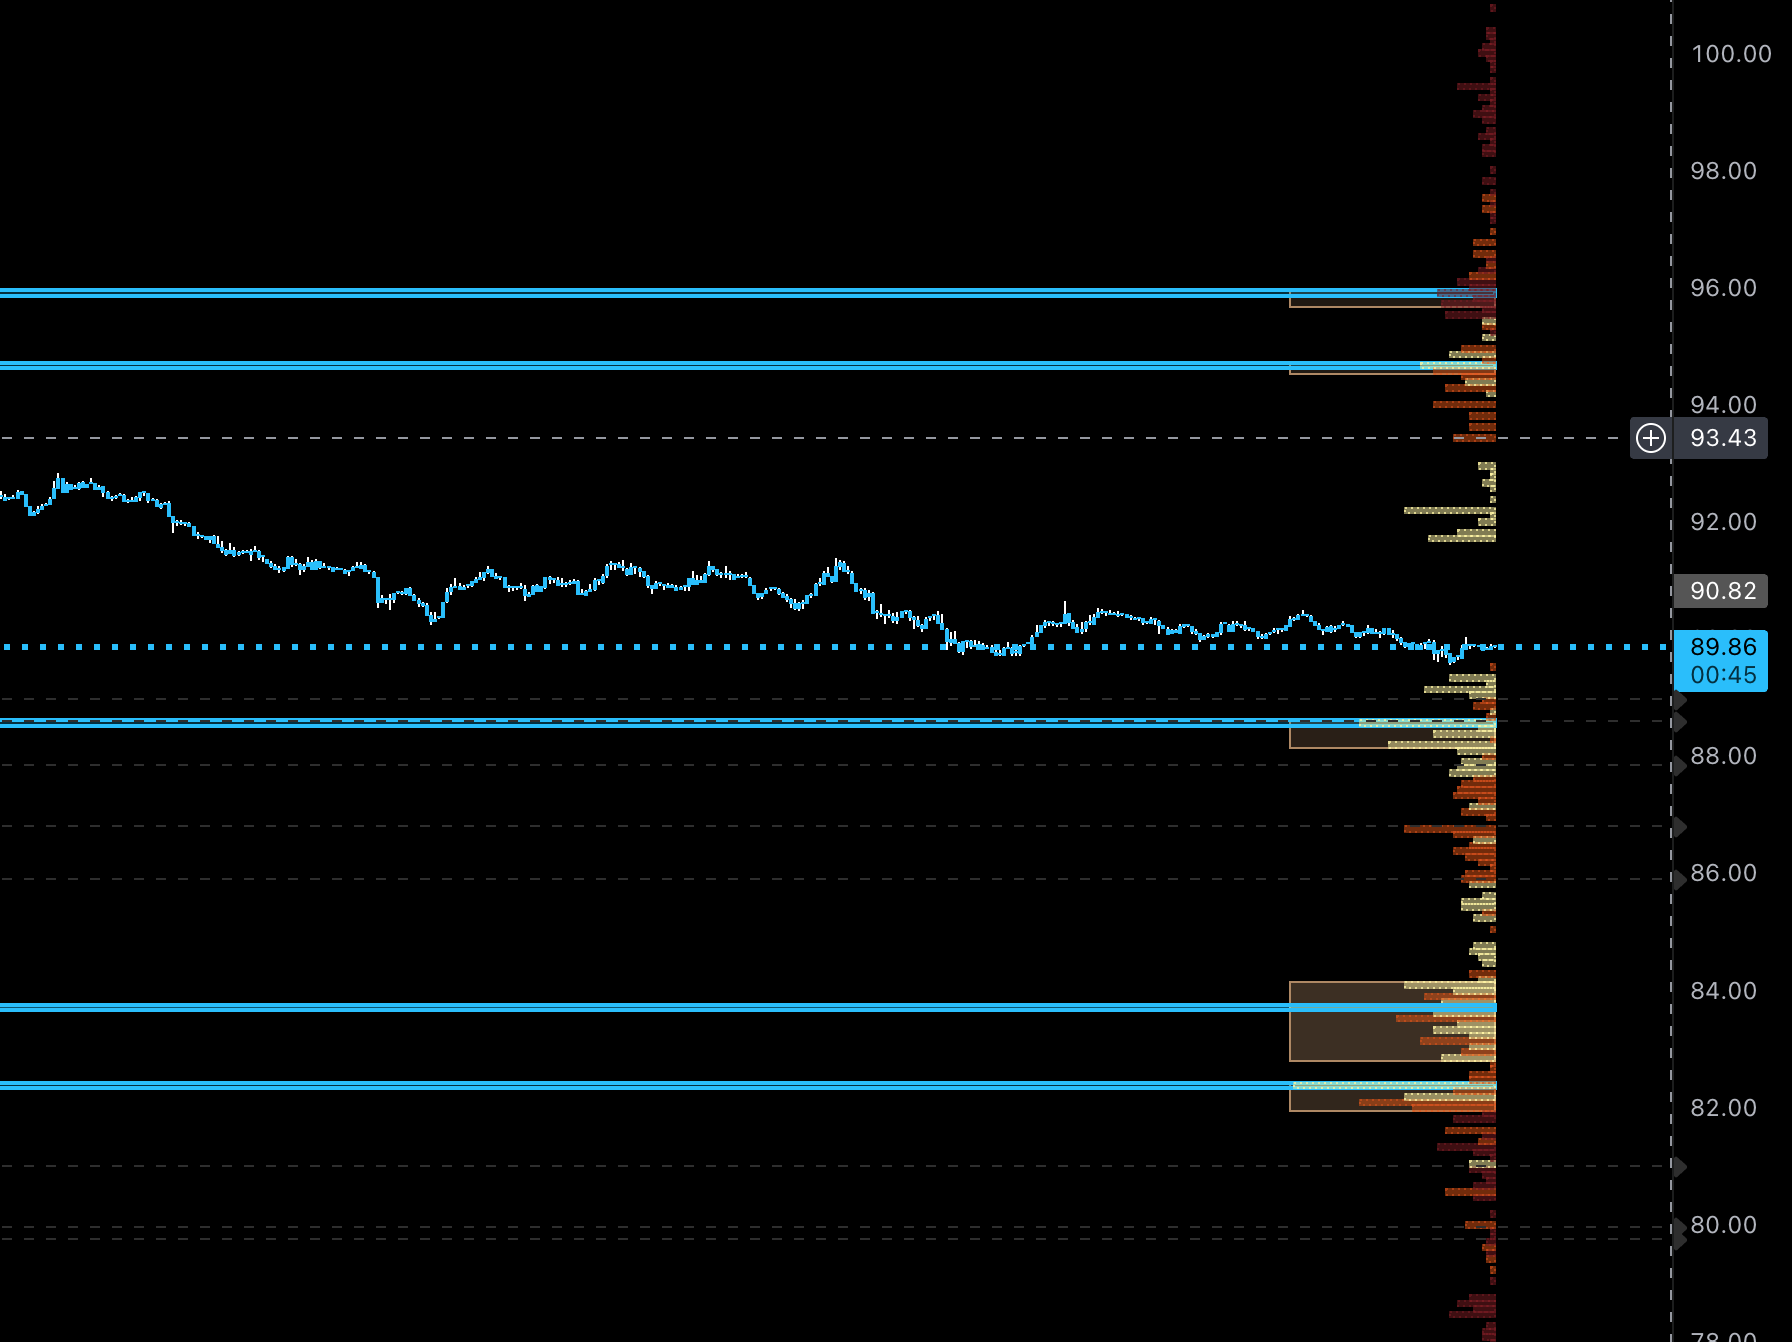
Horizontal lines are drawn at estimated liquidation prices whenever volume, open interest (OI), or CVD exceeds configurable thresholds.
When price reaches a level, it is marked as "filled." Unfilled levels remain on the chart as potential magnets for future price movement.
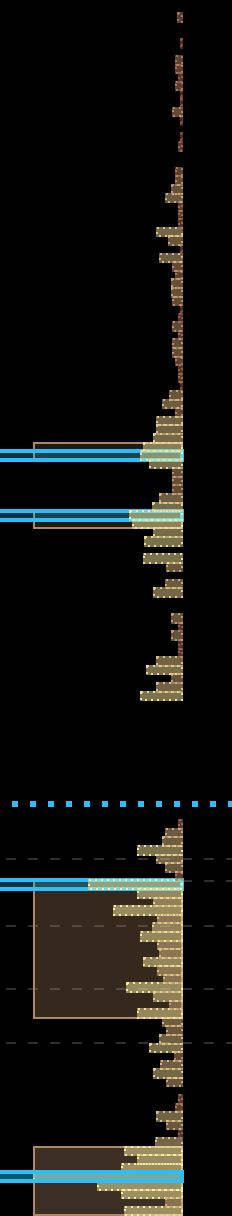
Liquidity Profile
A volume-profile-style histogram is rendered to the right of the price, showing the distribution of all unclaimed liquidation levels.
Liquidity Pools
Clusters of high-density liquidity rows are automatically grouped into pool boxes. Each pool highlights a contiguous zone of significant unclaimed liquidity. The peak row within each pool is emphasized to identify the "core" of the zone.
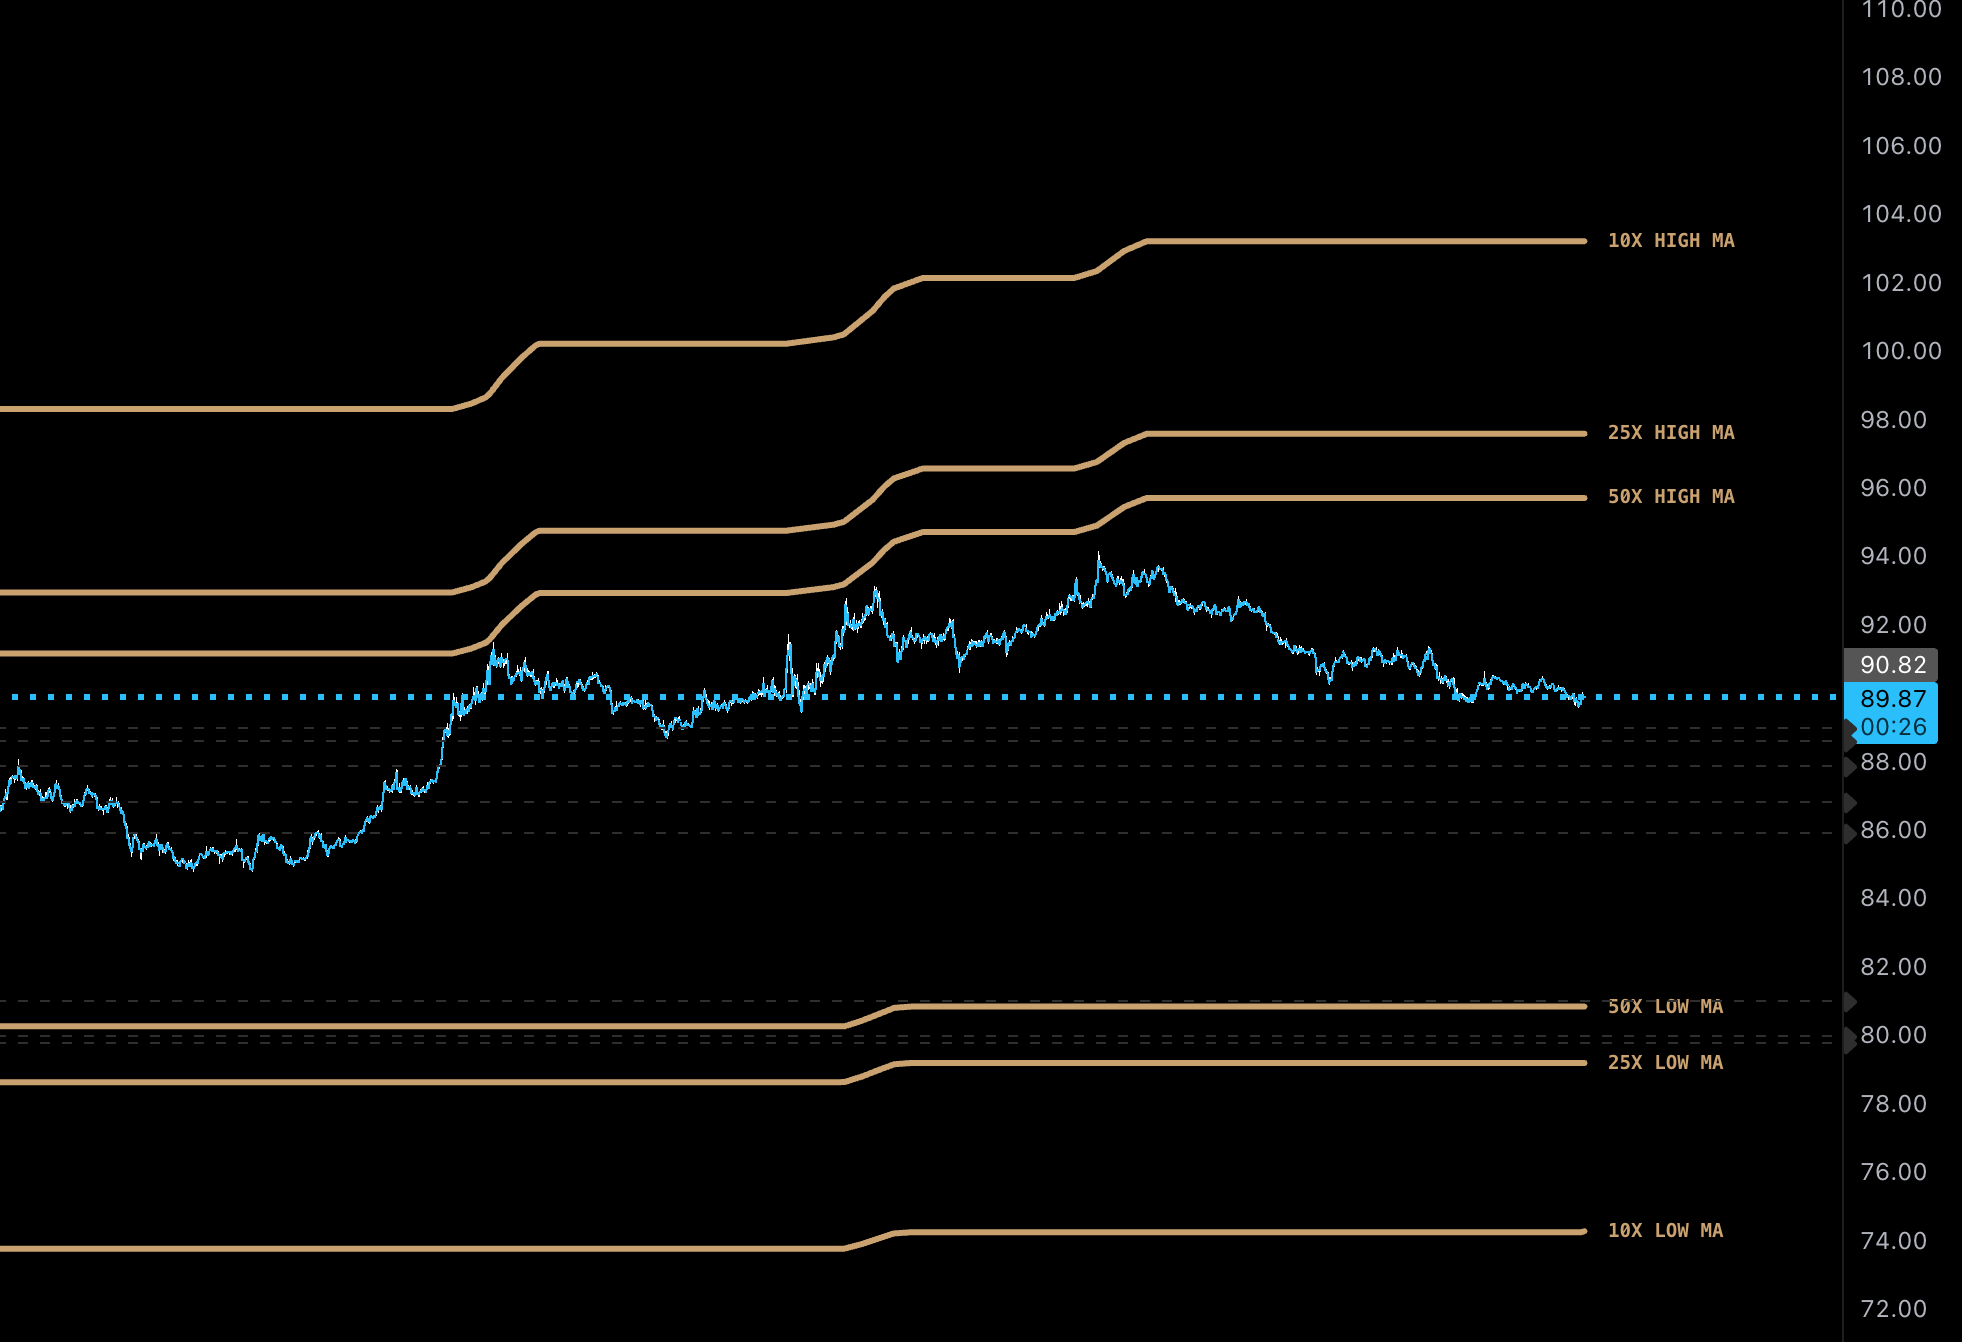
Range Lines and Moving Averages
High/Low range lines track the outermost unfilled levels for each leverage tier. You can also enable Fibonacci-based moving averages (Upper, Mid, Lower) derived from the highest enabled leverage range to provide trend-following context.
Profile Focused View
Hides liquidation levels and shows profile in-line with latest price for a cleaner read on liquidity pools.
Liquidity Signals
When enabled, the indicator generates:
Details
Detection Method
The indicator monitors three sources for statistical anomalies: Volume, OI Delta, and CVD. Each is compared against its rolling mean and standard deviation over a 150-bar lookback. Levels are projected when activity exceeds the mean by:
Level Consolidation
To reduce clutter, nearby levels within the same tier are merged if they fall within the Merge Threshold (default 0.05%). Merged levels display a volume-weighted average price (VWAP) and thicker lines to indicate higher density.
Settings
| Section | Key Options |
| Quick Settings | Toggle Lines, Profile, Pools, and Max Liq Zone visibility. |
| Data Source | Select between VOL, OI, OI+VOL (Recommended), or CVD. |
| Thresholds | Adjust Standard Deviations for Small, Medium, and Large triggers. |
| Levels | Enable/Disable specific leverage tiers (10x through 200x). |
| Range Lines | Enable H/L boundaries, SMA smoothing, and Fib-based MAs. |
| Liquidity Profile | Row size (granularity), Display Mode (Count/Weighted), and Range Mode. |
Methodology
The source code is protected due to the proprietary implementation of: