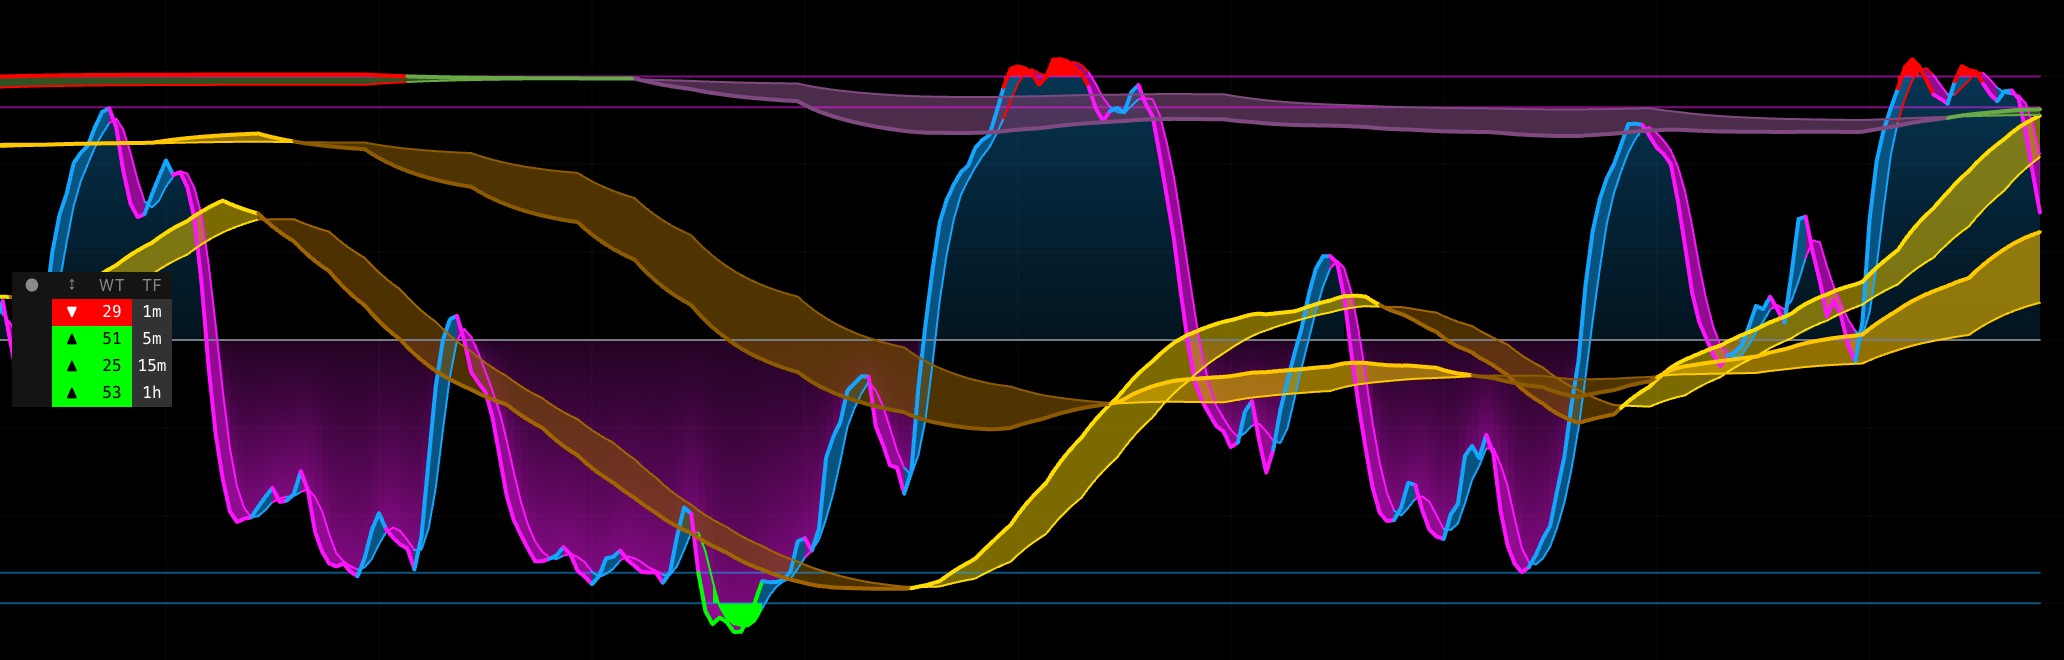
The WaveTrend Multi-Timeframe (MTF) indicator extends the standard WaveTrend algorithm with three specific capabilities: simultaneous display of four timeframes (1m, 5m, 15m, 1h) with auto-hide logic, a multi-timeframe alignment signal, and a crossover filtering system that distinguishes initial entries from follow-through moves.
While the base WaveTrend calculation (EMA of HLC3 smoothed into WT1 and WT2) is public domain, this indicator adds a proprietary analytical framework on top of it to filter noise and identify high-conviction momentum shifts.
WHAT MAKES THIS ORIGINAL
1. Timeframe Hierarchy Auto-Hide
Standard MTF oscillators often produce misleading readings when a lower timeframe is viewed on a higher timeframe chart because the data is averaged and "dampened."
This indicator dynamically calculates the current chart's timeframe.If the chart timeframe equals or exceeds the MTF target, that specific oscillator is automatically hidden.This ensures you only see oscillators that can reach their true statistical extremes on your current view.2. Three-Timeframe Alignment Signal
Star markers (★) appear when the current timeframe, 15-minute, and 1-hour oscillators are simultaneously in extreme territory (overbought or oversold).
Convergence: This represents a rare alignment of short-term, intermediate, and structural momentum.Consecutive Prevention: The signal only fires on the first bar of alignment to prevent chart clutter.3. Extreme-Zone Crossover Filtering
Standard crossovers can be noisy during strong trends. This indicator uses a state machine to track oscillator behavior:
Entry Flag: A flag is set only when the oscillator enters an extreme zone (Level 1).Signal Counting: It distinguishes the first crossover after entering the zone from subsequent crossovers.Visual Hierarchy: Initial reversal signals are displayed as tiny markers, while follow-through signals appear as small markers, allowing you to gauge the "age" of the trend move.4. Multi-Layer Gradient Fill System
The oscillator pane uses a layered visual architecture to help you process multiple timeframes at once:
Base Gradient: Extends from the zero line toward the lines with directional coloring.MTF Transparency Scaling: Progressively deeper transparency for higher timeframes (50% for 1m down to 20% for 1h).Foreground Extreme Fill: High-contrast highlighting for any region beyond the Overbought/Oversold Level 1 lines.
USAGE
Reading WaveTrend Signals
Each enabled timeframe displays its own WT1/WT2 lines.
Bullish Signal: WaveTrend crosses above the oversold level.Bearish Signal: WaveTrend crosses below the overbought level.Alignment and Crossover Markers
Star Markers (★): Signal high-conviction alignment across the current, 15m, and 1h timeframes.Filtered Crossovers: Only appear if the oscillator has entered an extreme zone. The size of the marker tells you if it is the first cross or a subsequent one.
DETAILS
WaveTrend Calculation
The calculation follows three primary steps:
EMA of Typical Price (HLC3): Computed over the channel length.Absolute Deviation: Smoothed with another EMA of the same length.Normalized Difference (CI): Smoothed to produce WT1; a simple SMA of WT1 produces WT2.For higher timeframes, the full calculation is performed via request.security() and brought down to the current chart.
Crossover State Machine
The indicator tracks two boolean flags (been_oversold, been_overbought) and two counters. These reset only when the oscillator returns inside Level 2 (the buffer zone). This ensures that signals are only generated when the market is truly overextended.
SETTINGS
WaveTrend & Timeframes
Channel Length: EMA period for the price channel (default: 9).Average Length: EMA period for final smoothing (default: 12).Show 1m / 5m / 15m / 1H: Individual toggles for each oscillator layer.Signals & Smoothing
Show Alignment Stars: Toggle the 3-TF alignment markers.Crossover Toggles: Independently enable/disable first or subsequent crossovers.MTF Smoothing: Apply SMA, EMA, or Double EMA to higher timeframe data to remove the "staircase" visual artifact.
METHODOLOGY
The source code is protected because it contains the proprietary logic for:
Dynamic Auto-Hide Hierarchy based on chart timeframe.3-TF Alignment Detection with single-print logic.Crossover State Machine for entry/exit tracking.Layered Gradient Fill Architecture with transparency scaling.💡Disclaimer: This is an oscillator-based tool and does not constitute financial advice. Overbought and oversold conditions do not guarantee reversals. Past performance does not guarantee future results.