Trend MTF
The Trend MTF indicator provides multi-timeframe trend detection by comparing Smoothed Moving Average (SMMA) values of close and open on five simultaneous timeframes. Rather than using fixed higher-timeframe requests, it introduces a Resolution Multiplier system that dynamically scales each timeframe relative to the chart period—producing trend signals that adapt to the chart's granularity.
The indicator also integrates two independent anomaly detection systems: Keltner Channel pressure zones using a 2.618x ATR multiplier, and extreme volume classification at 500%+ of the rolling average.
WHAT MAKES THIS ORIGINAL
1. Resolution Multiplier System
Standard MTF indicators use fixed timeframes (e.g., always 1H). This indicator uses a Resolution Multiplier (default: 6x) that scales relative to your current chart.
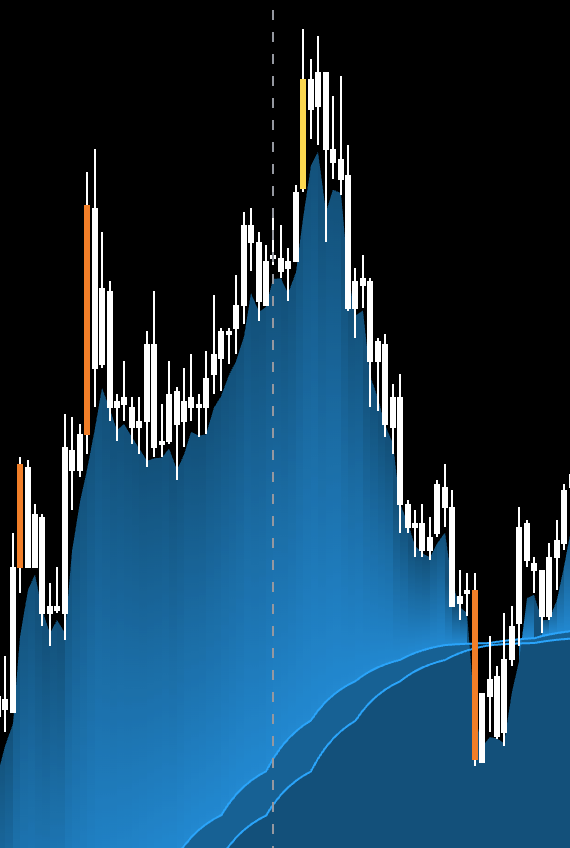
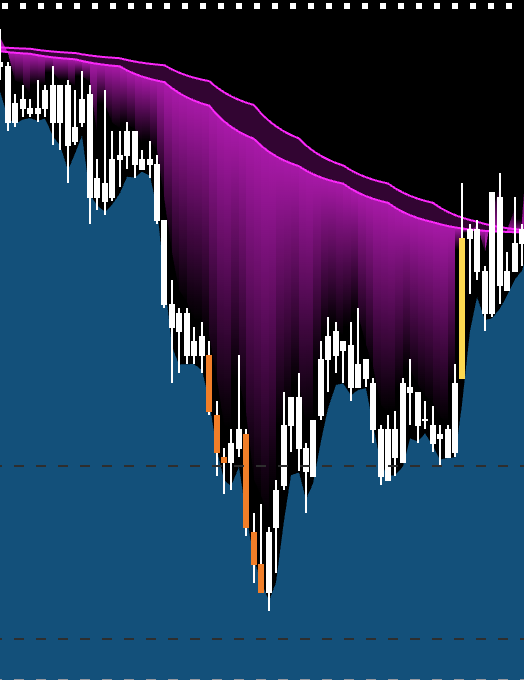
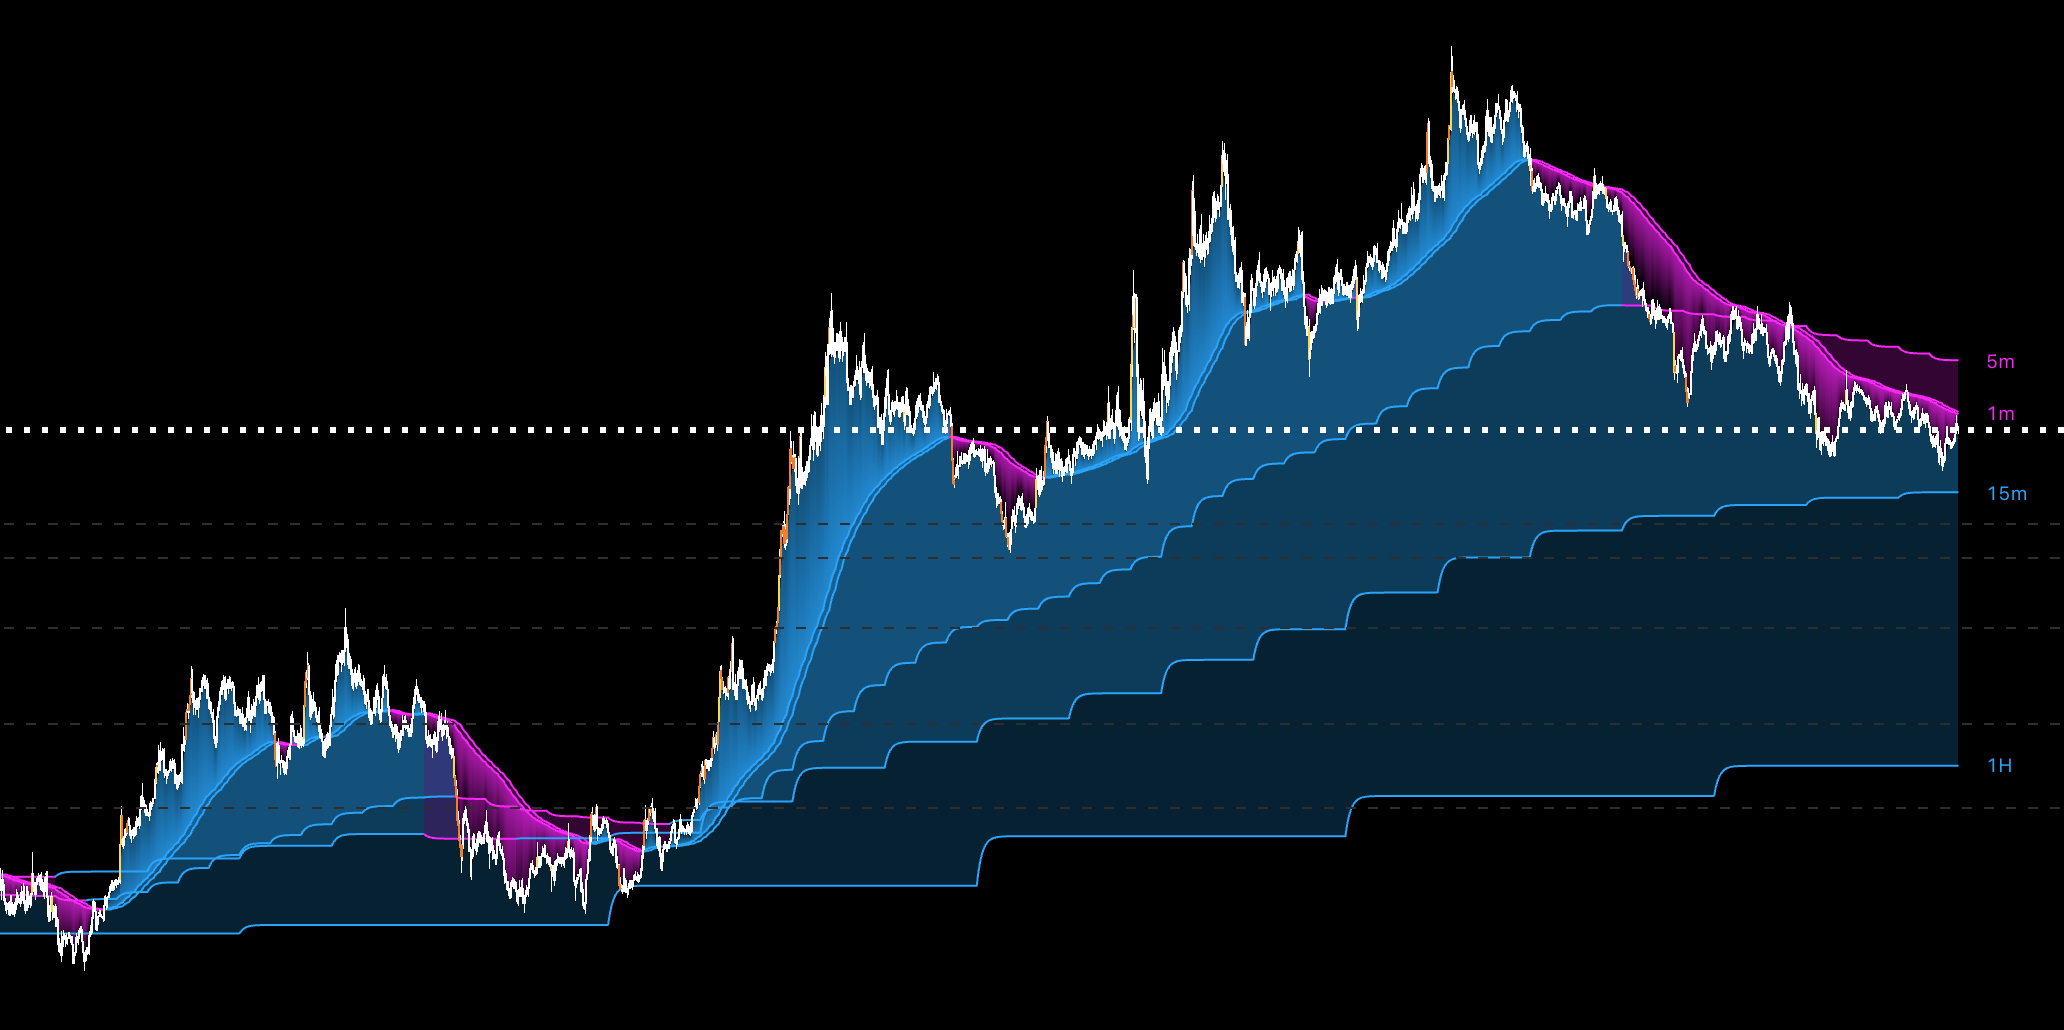
2. Directional Gradient Fill with Conditional Anchoring
The trend visualization uses a gradient system that extends from the SMMA line toward a dynamic anchor:
3. Dual Anomaly Detection Layers
Beyond trend direction, two independent systems overlay on the chart:
USAGE
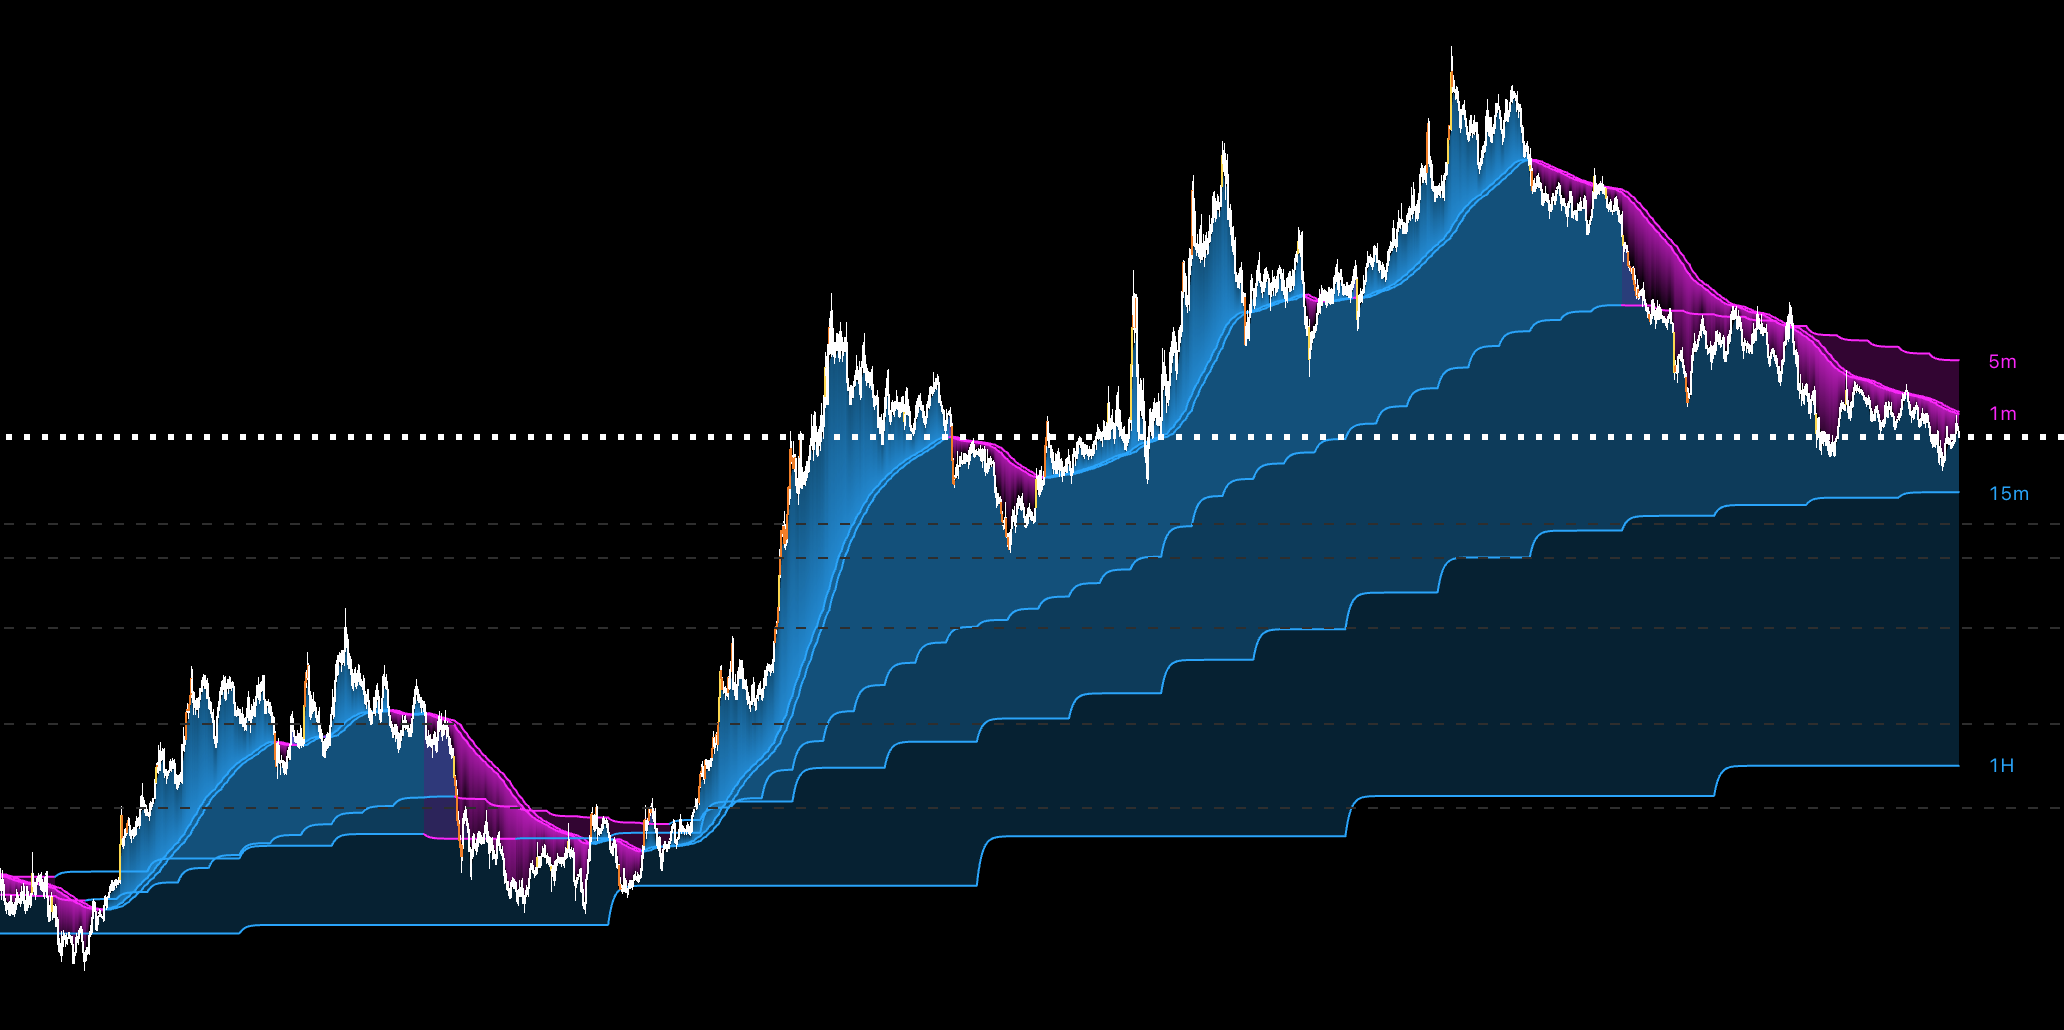
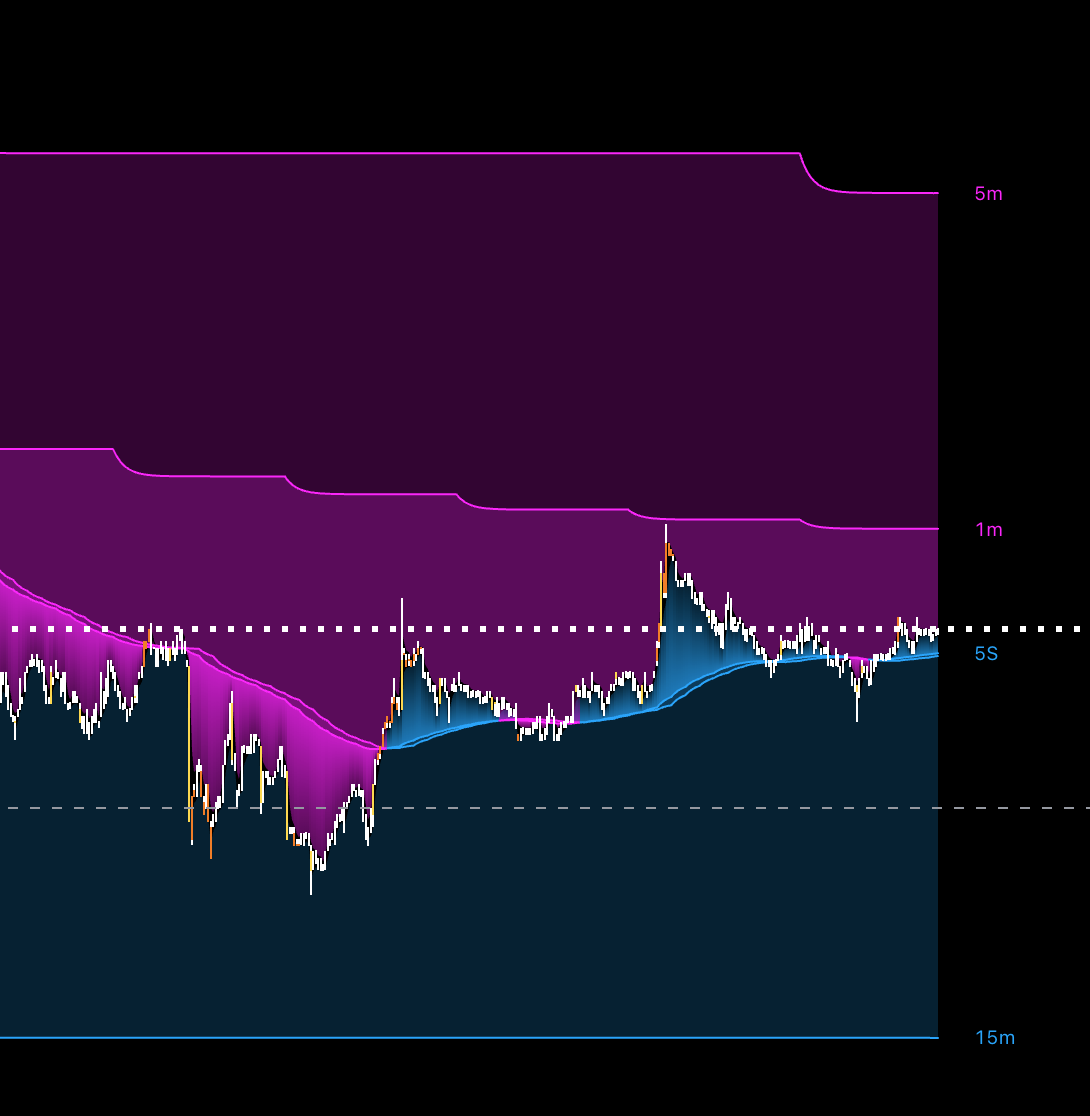
Reading Multi-Timeframe Trends
Each enabled timeframe displays an SMMA line.
Pressure Zone Detection
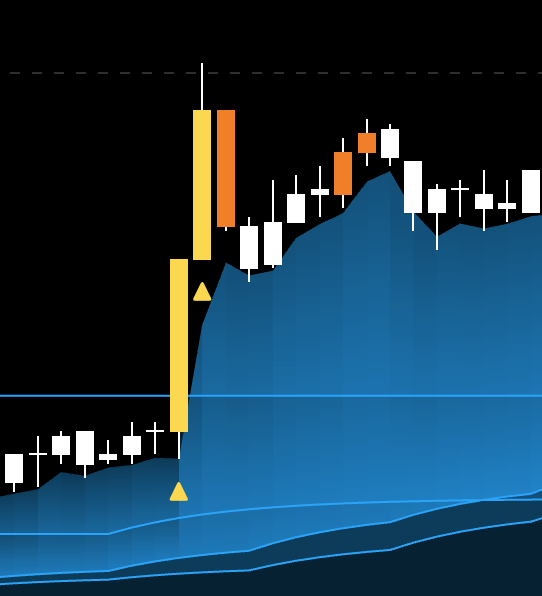
When price closes beyond the 2.618x ATR bands, candles are colored in a distinct pressure color (default: orange). This highlights overextended conditions where a reversal or consolidation is statistically more likely.
Extreme Volume Detection
Candles with volume exceeding 500% of the average are flagged with a yellow color and triangle markers. These represent significant market participation or "market maker" activity.
Candle Coloring Priority
The indicator uses a hierarchy to ensure the most important information is visible:

DETAILS
SMMA Calculation
The Smoothed Moving Average is calculated recursively: $$SMMA = \frac{PrevSMMA \times (Length - 1) + CurrentSource}{Length}$$ This provides a smoother result than a simple SMA while maintaining a "longer memory" of price action.
Resolution Multiplier Logic
Effective resolution = $CurrentChartPeriod \times ResolutionMultiplier$. On seconds charts, the MTF targets automatically shift (e.g., to 1m, 5m, 15m) to maintain meaningful trend separation.
Keltner Pressure
The Keltner Channel uses a 20-period EMA center with bands at: $$Upper/Lower = EMA \pm (2.618 \times ATR(10))$$ The 2.618 multiplier ensures that only extreme volatility expansion is flagged as a "pressure" event.
SETTINGS
| Category | Key Settings |
| Candles | Toggles for Pressure, Market Maker (Volume), and Trend coloring. |
| SMMA | Resolution Multiplier (scales MTF) and Smoothing Period. |
| Timeframes | Toggle visibility for Current TF, 5m, 15m, 1H, and 4H layers. |
| Visuals | Adjust MTF fill transparency for better chart clarity. |
METHODOLOGY
The source code is protected because it contains proprietary implementations of: